Quick start guide
Basic workflow
graph LR
  A[add<br/>subject]-->B[add<br/>plan]-->C[add<br/>images]-->D[position<br/>transducer]-->E[add<br/>sonications]-->F[adjust<br/>simulation<br/>domain]-->G[evaluate<br/>plan]-->H[generate<br/>report]
Quick start instructions
- Install k-Plan following the installation instructions and login using your credentials.
-
The first window displayed after login is the subject browser dialog. To create a new subject, click
Add Newand enter the required subject details, then clickSave.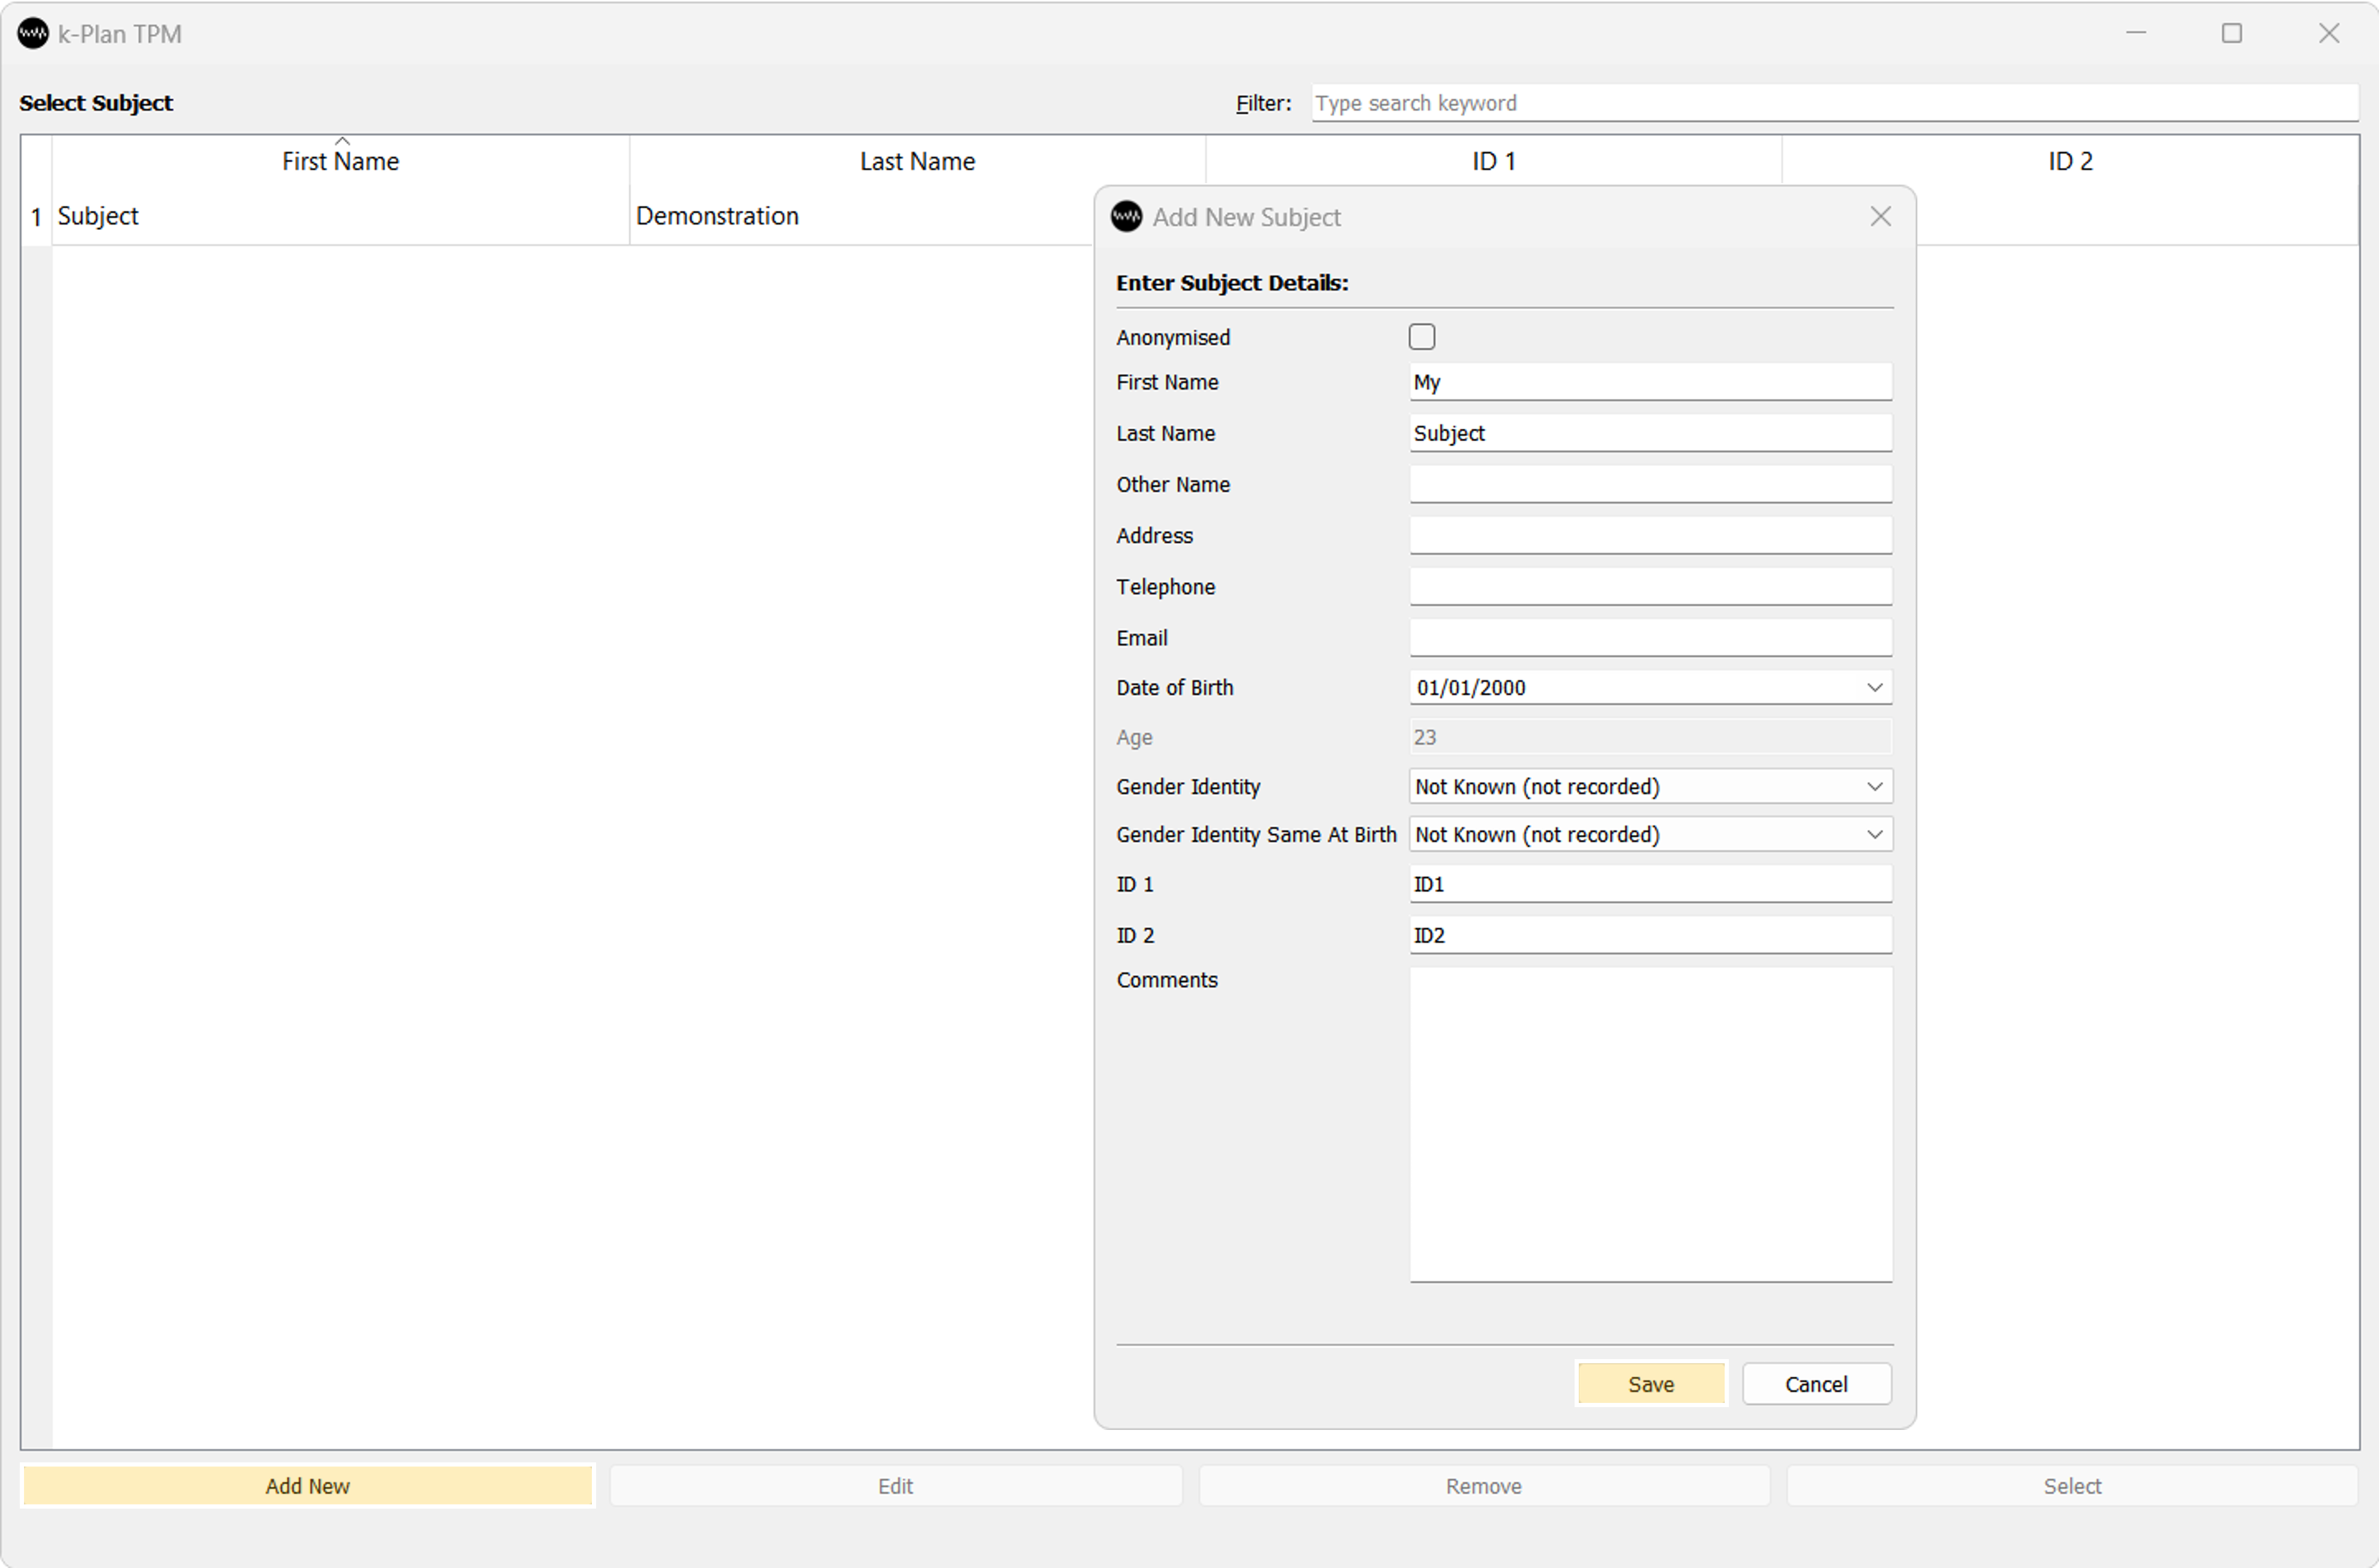
-
Select the subject by double clicking on the subject entry (or clicking on
Select). -
The next window displayed is the plan browser dialog. To create a new plan, click
Add Newto create a new plan for the selected subject.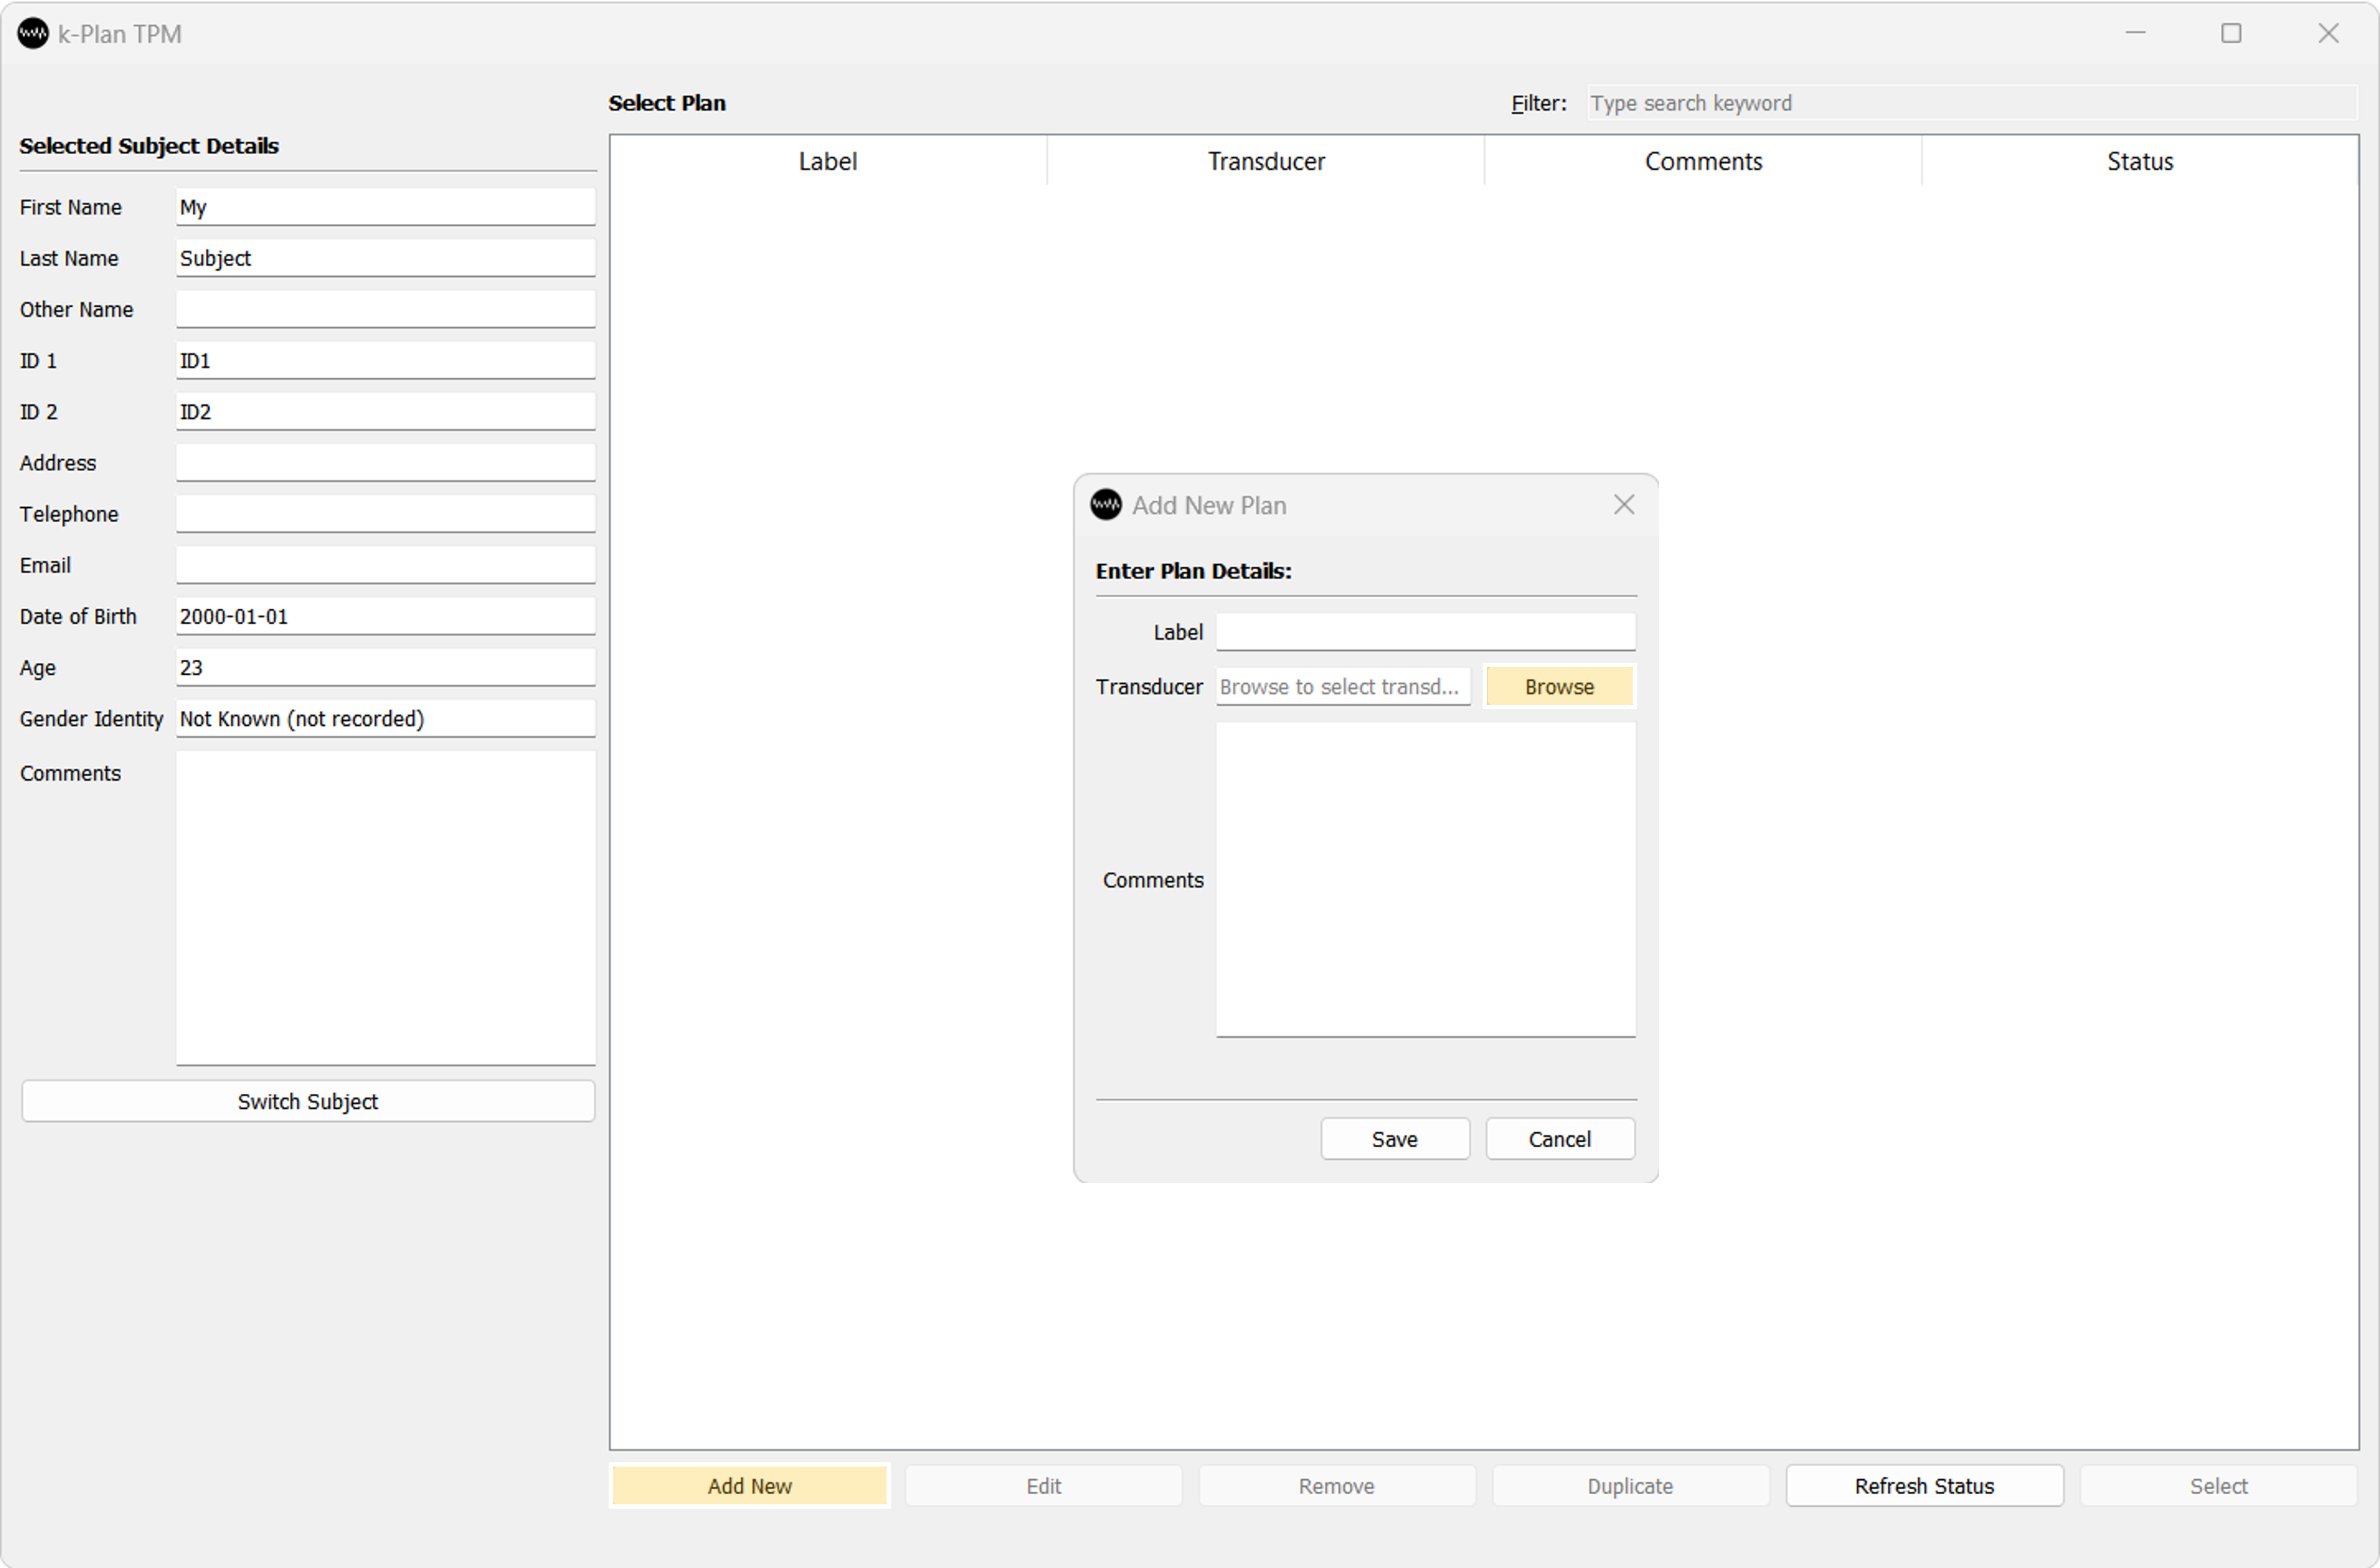
-
In the add new plan dialog, click
Browseto open the transducer selection dialog. -
In the transducer selection dialog, select the
Annular Arraytransducer by double clicking on the transducer entry (or clickingSelect).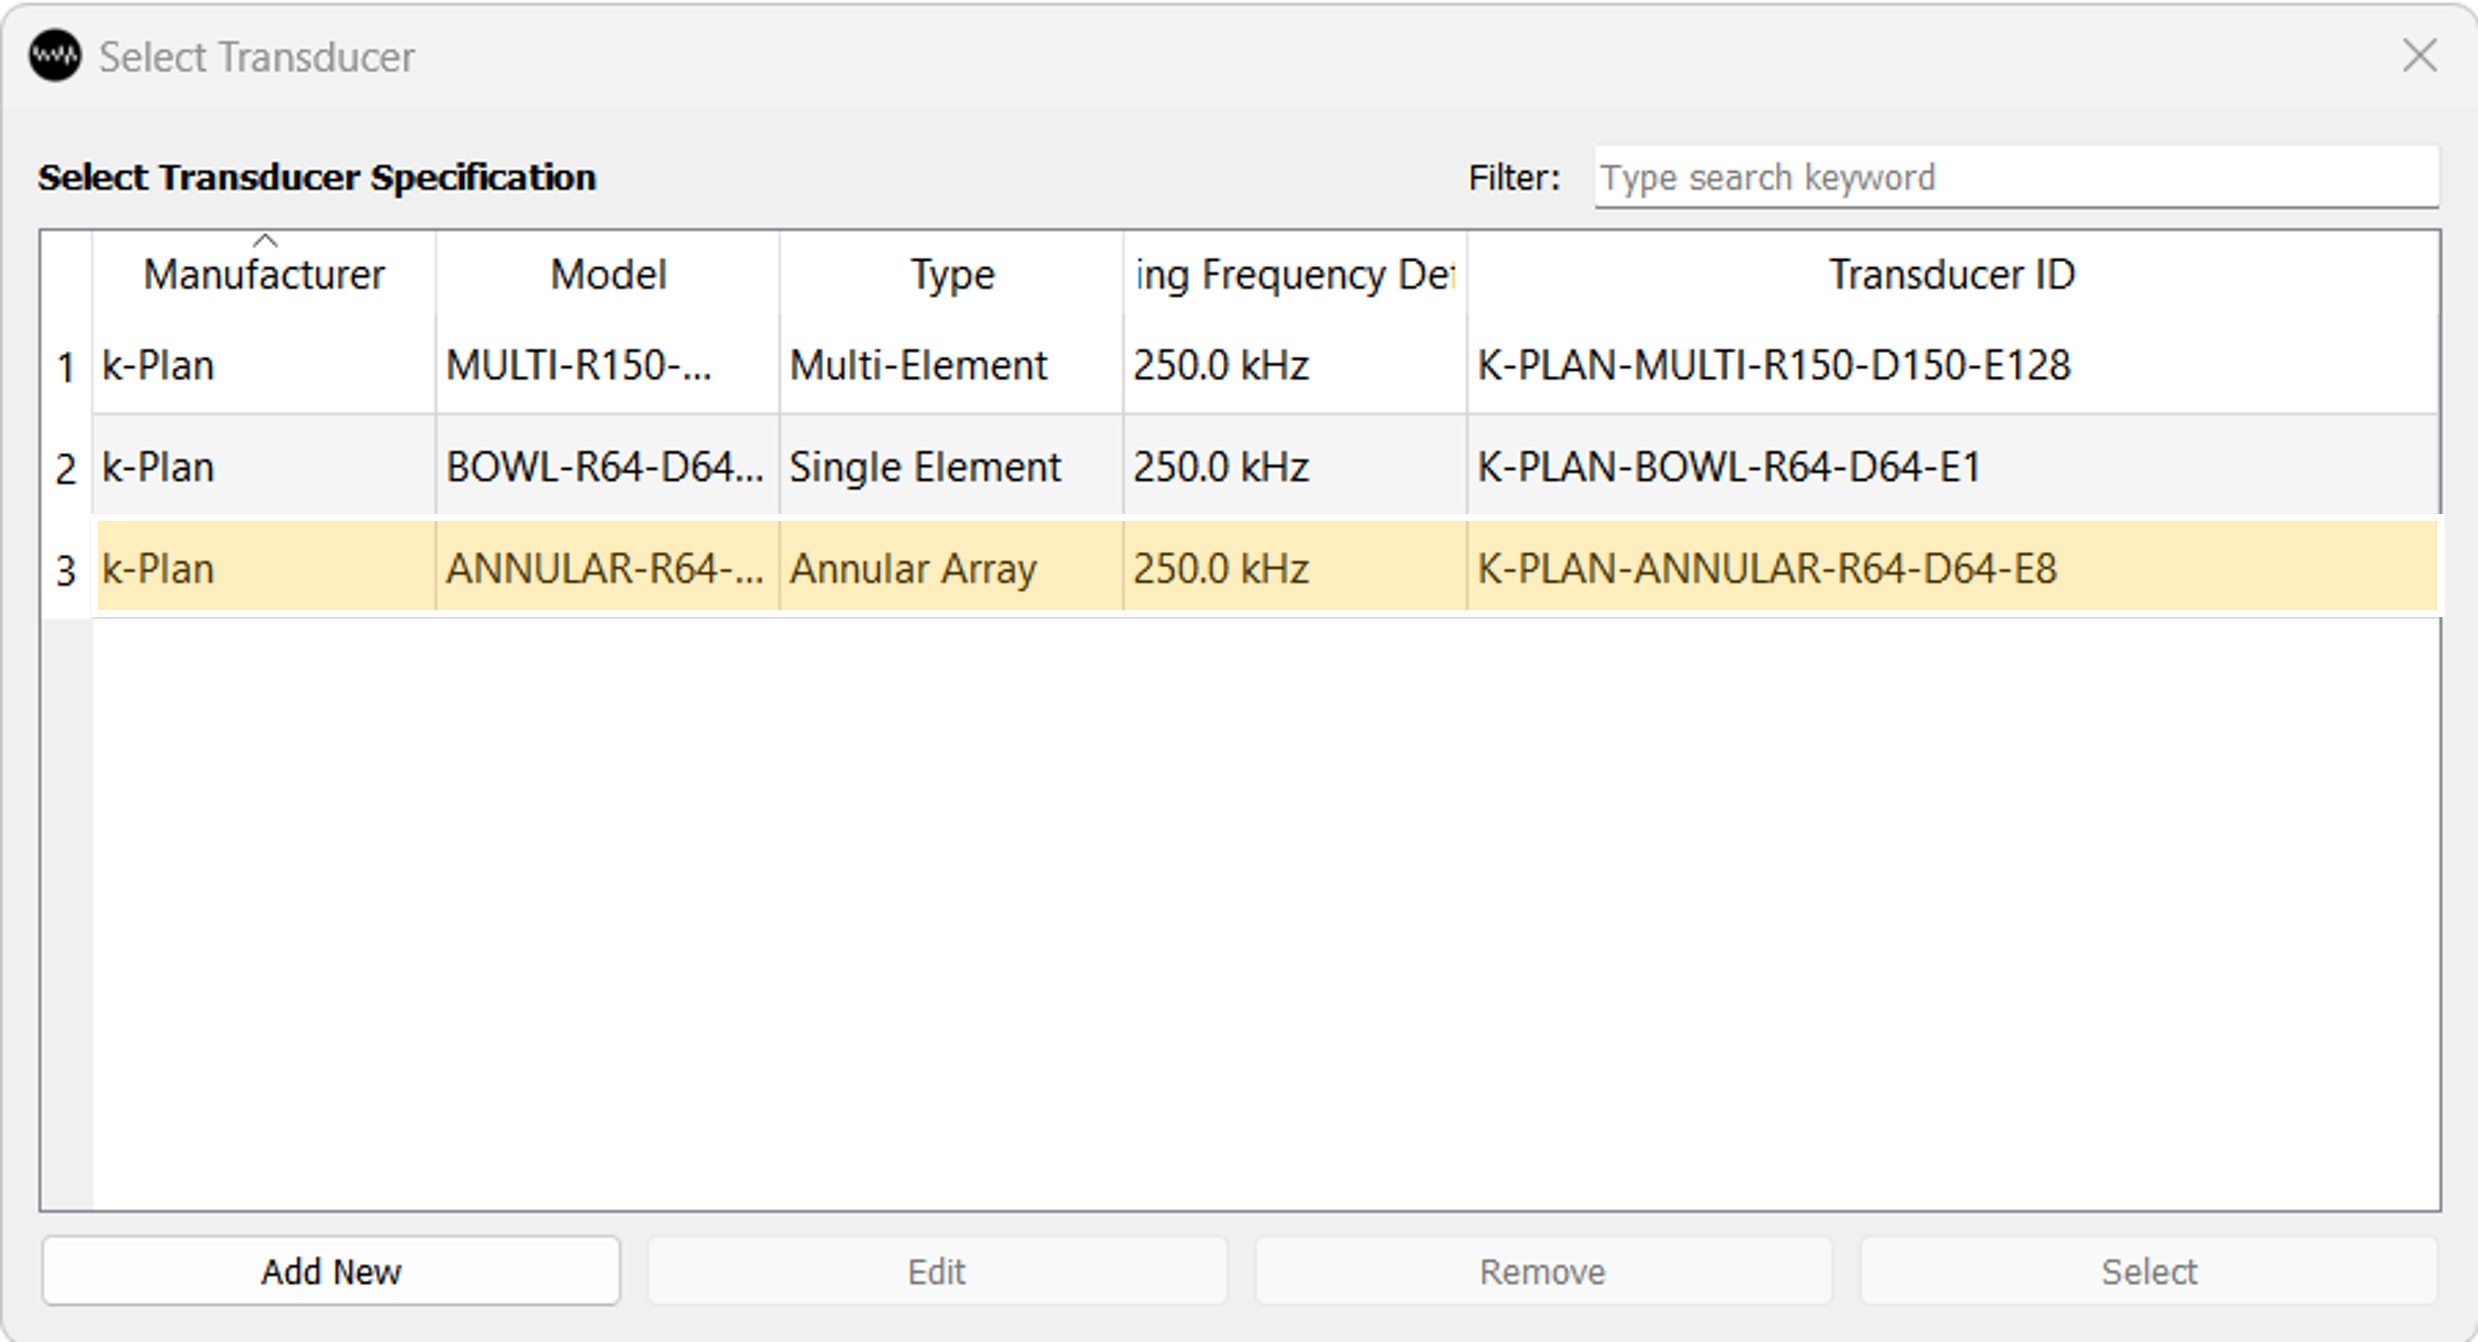
-
Give the plan a label and add any comments, then click
Save. - In the plan browser dialog, select the plan by double clicking on the plan entry (or clicking on
Select). - The next window displayed is the plan developer dialog. This is the main dialog where plans are set up and evaluated.
-
On the
Imagestab, selectAdd MNI Template. This will add a CT image and MR image based on the MNI-152 template. The CT is automatically selected as the primary planning image along with a CT calibration curve for the MNI template image. The primary planning image is used to extract the acoustic and thermal material properties.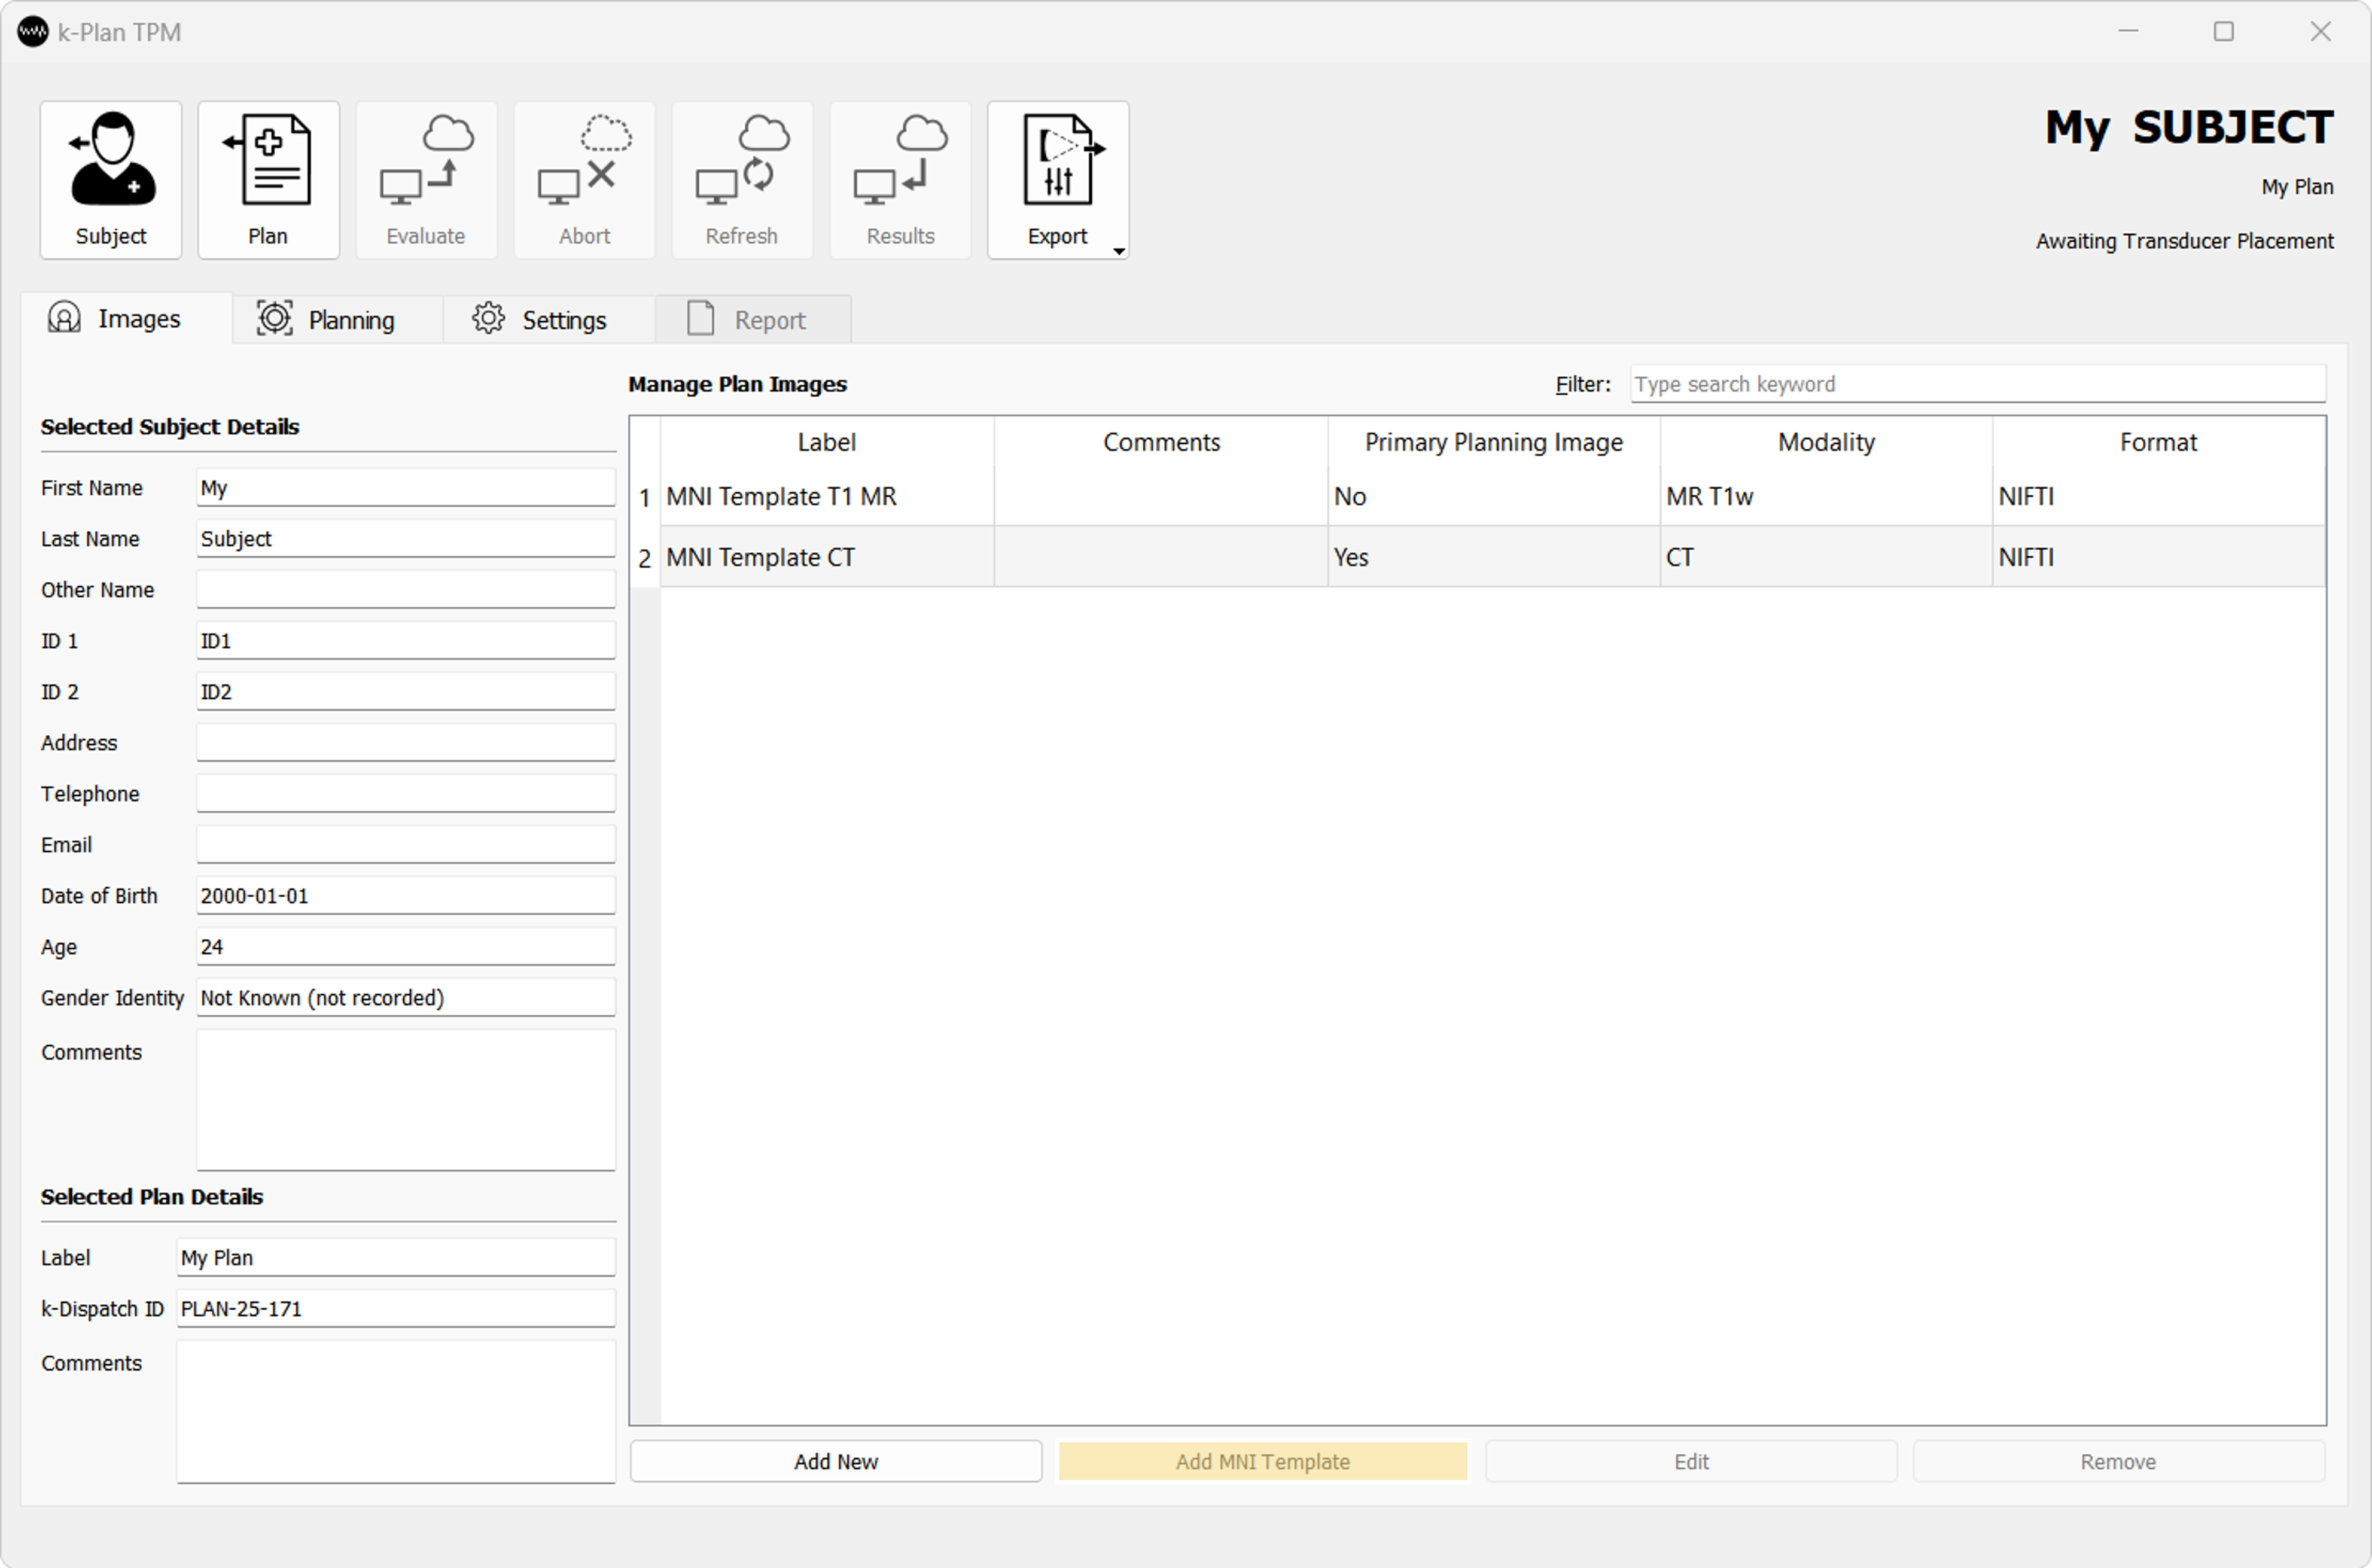
-
To view the plan images, select the
Planningtab. The default window shows three orthogonal 2D slices, along with a 3D view. The image display can be adjusted as follows:Left Mouse Click And Dragon the reslice cursor to change which slices are displayed
Right Mouse Click And Draganywhere on the image to zoomMouse Wheel Click And Draganywhere on the image to panMouse Wheel Scrollto move through the 2D image stack slice by sliceCTRL+Left Mouse Click And Dragto move through the 2D image stack quicklyLeft Mouse Click And Dragto move the 3D view
The image views can be maximised by clicking
 , or reset by clicking
  in the top right of each view.
 -
The plan images are listed in a table on the right hand side. The order in which the images are rendered can be adjusted by dragging the numbers up and down. The visibility of each image can be changed by selecting the 2D and 3D checkboxes.
Display settings can be adjusted by right-clicking on the image name. The colour map and window/level settings can be adjusted by selecting
Edit 2D Colour Map.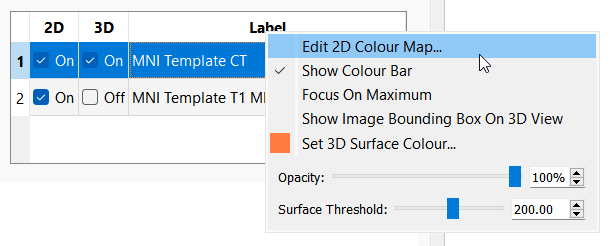
-
Position the transducer by selecting the
Automatically Place Transducer Using One Alt-Click button. On one of the image views, use
 Alt+Left Mouse Clickonce to set the desired target position in the brain. This will automatically compute the transducer position so that it is placed outside the head with the transducer beam axis approximately normal incidence to the skull.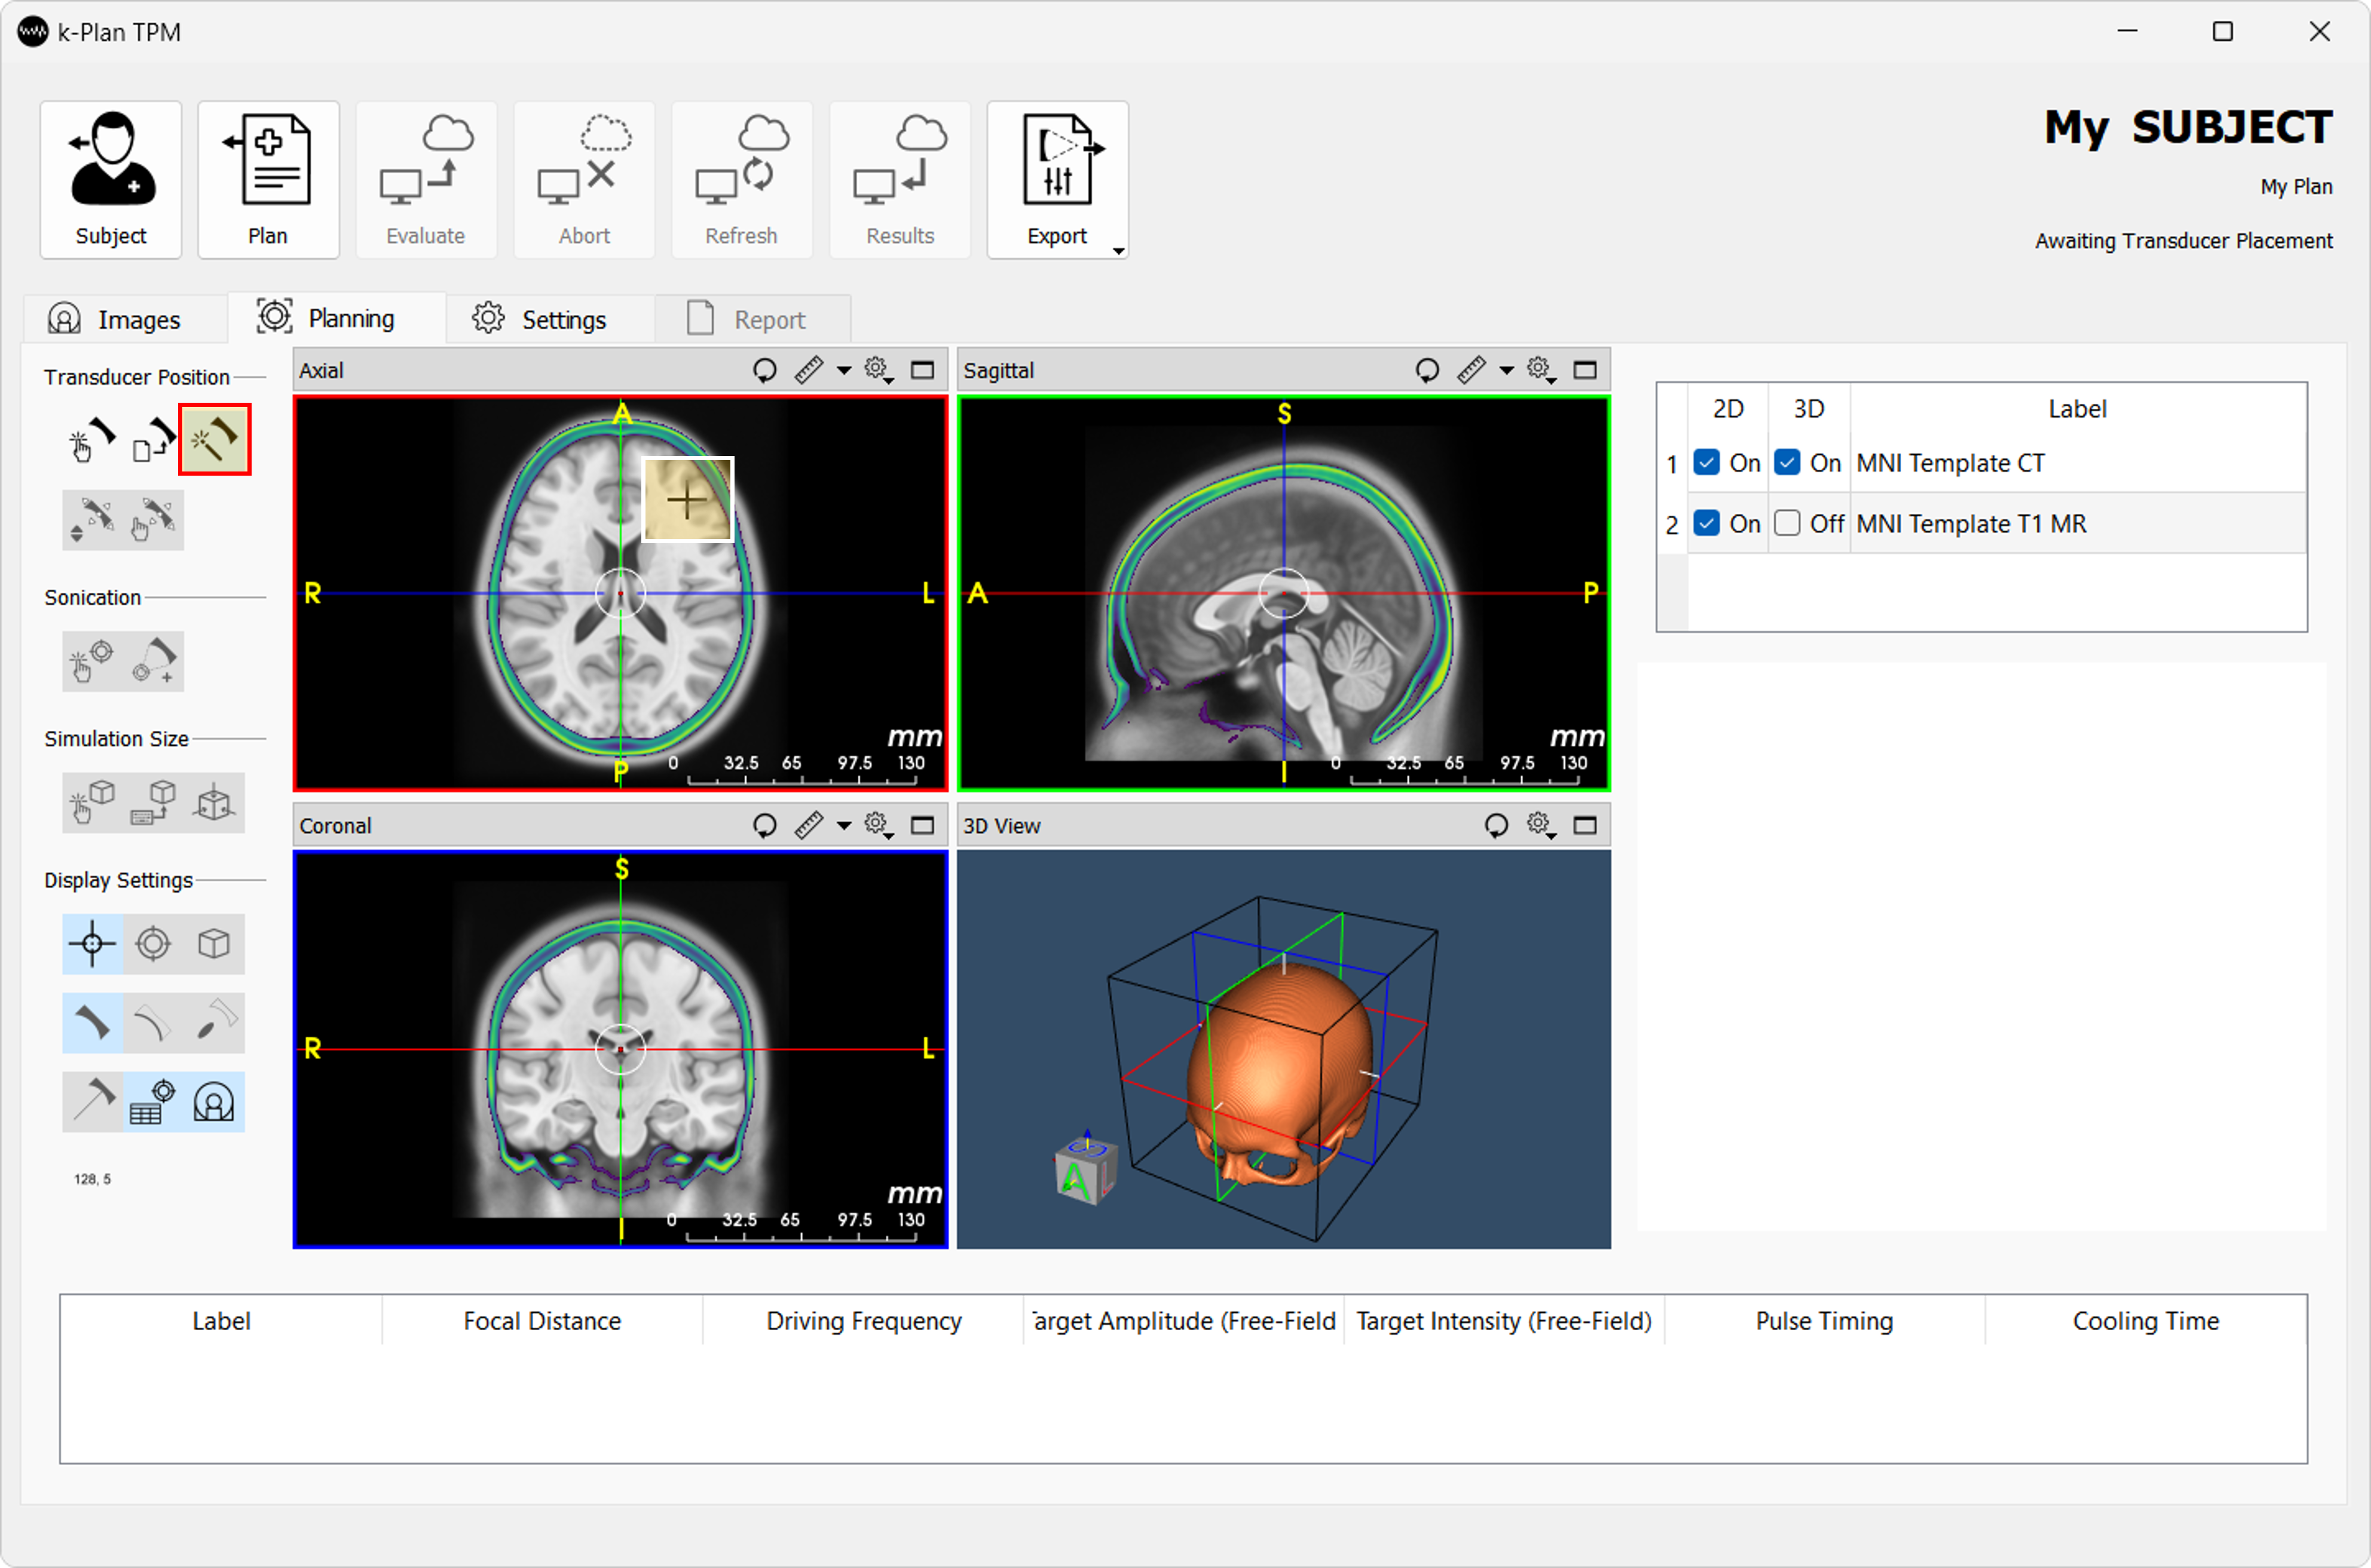
-
The transducer position can be adjusted by selecting the
Adjust Transducer Position button (and then adjusting the position values using the panel on the right hand side) or by selecting the
 Adjust Transducer Position Using Cursor button (and then clicking and dragging the red circles).
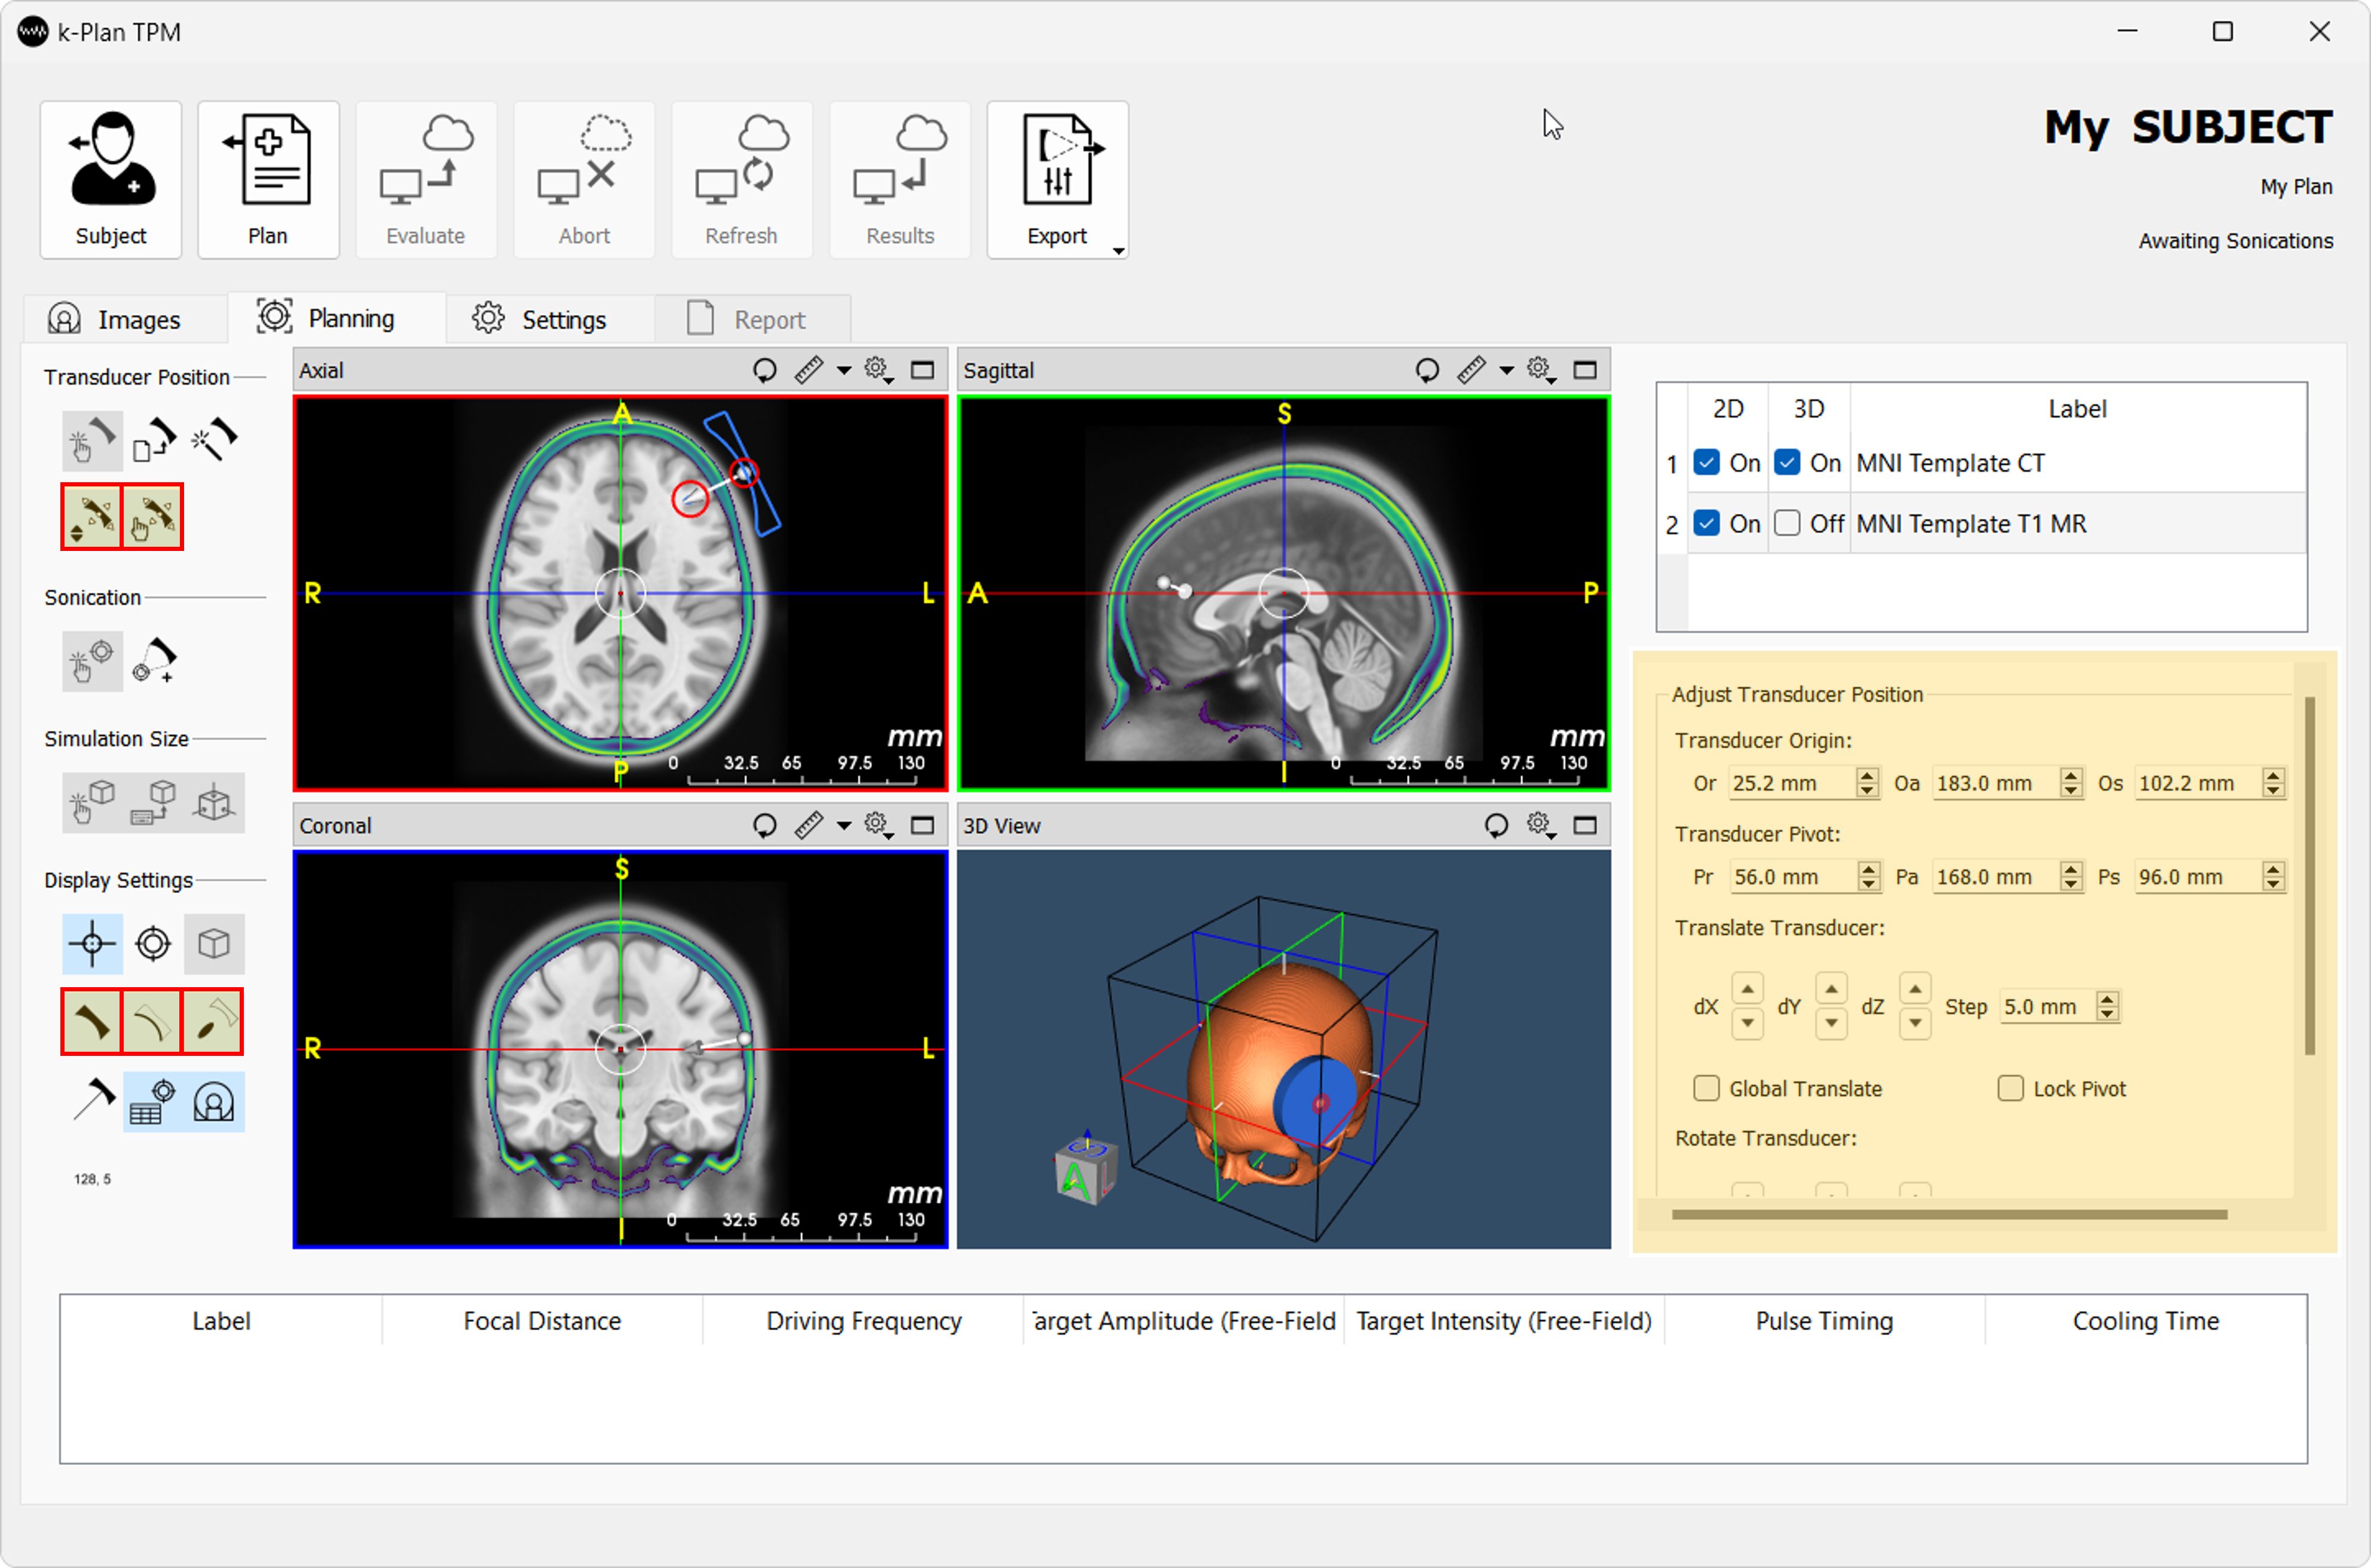
-
Toggle display of the focal position using the
View Transducer Focus button. For annular-array transducers, the distance between the transducer origin and the pivot points (shown with the red circles) is used to automatically adjust the focal distance, provided this distance is within the minimum and maximum focal distance allowed by the transducer.
 -
Select
Add Sonication For Current Transducer Position to add a sonication. Adjust the sonication parameters in the sonication browser table at the bottom of the screen. To adjust the focal distance, driving frequency, etc, double click on the table entries.
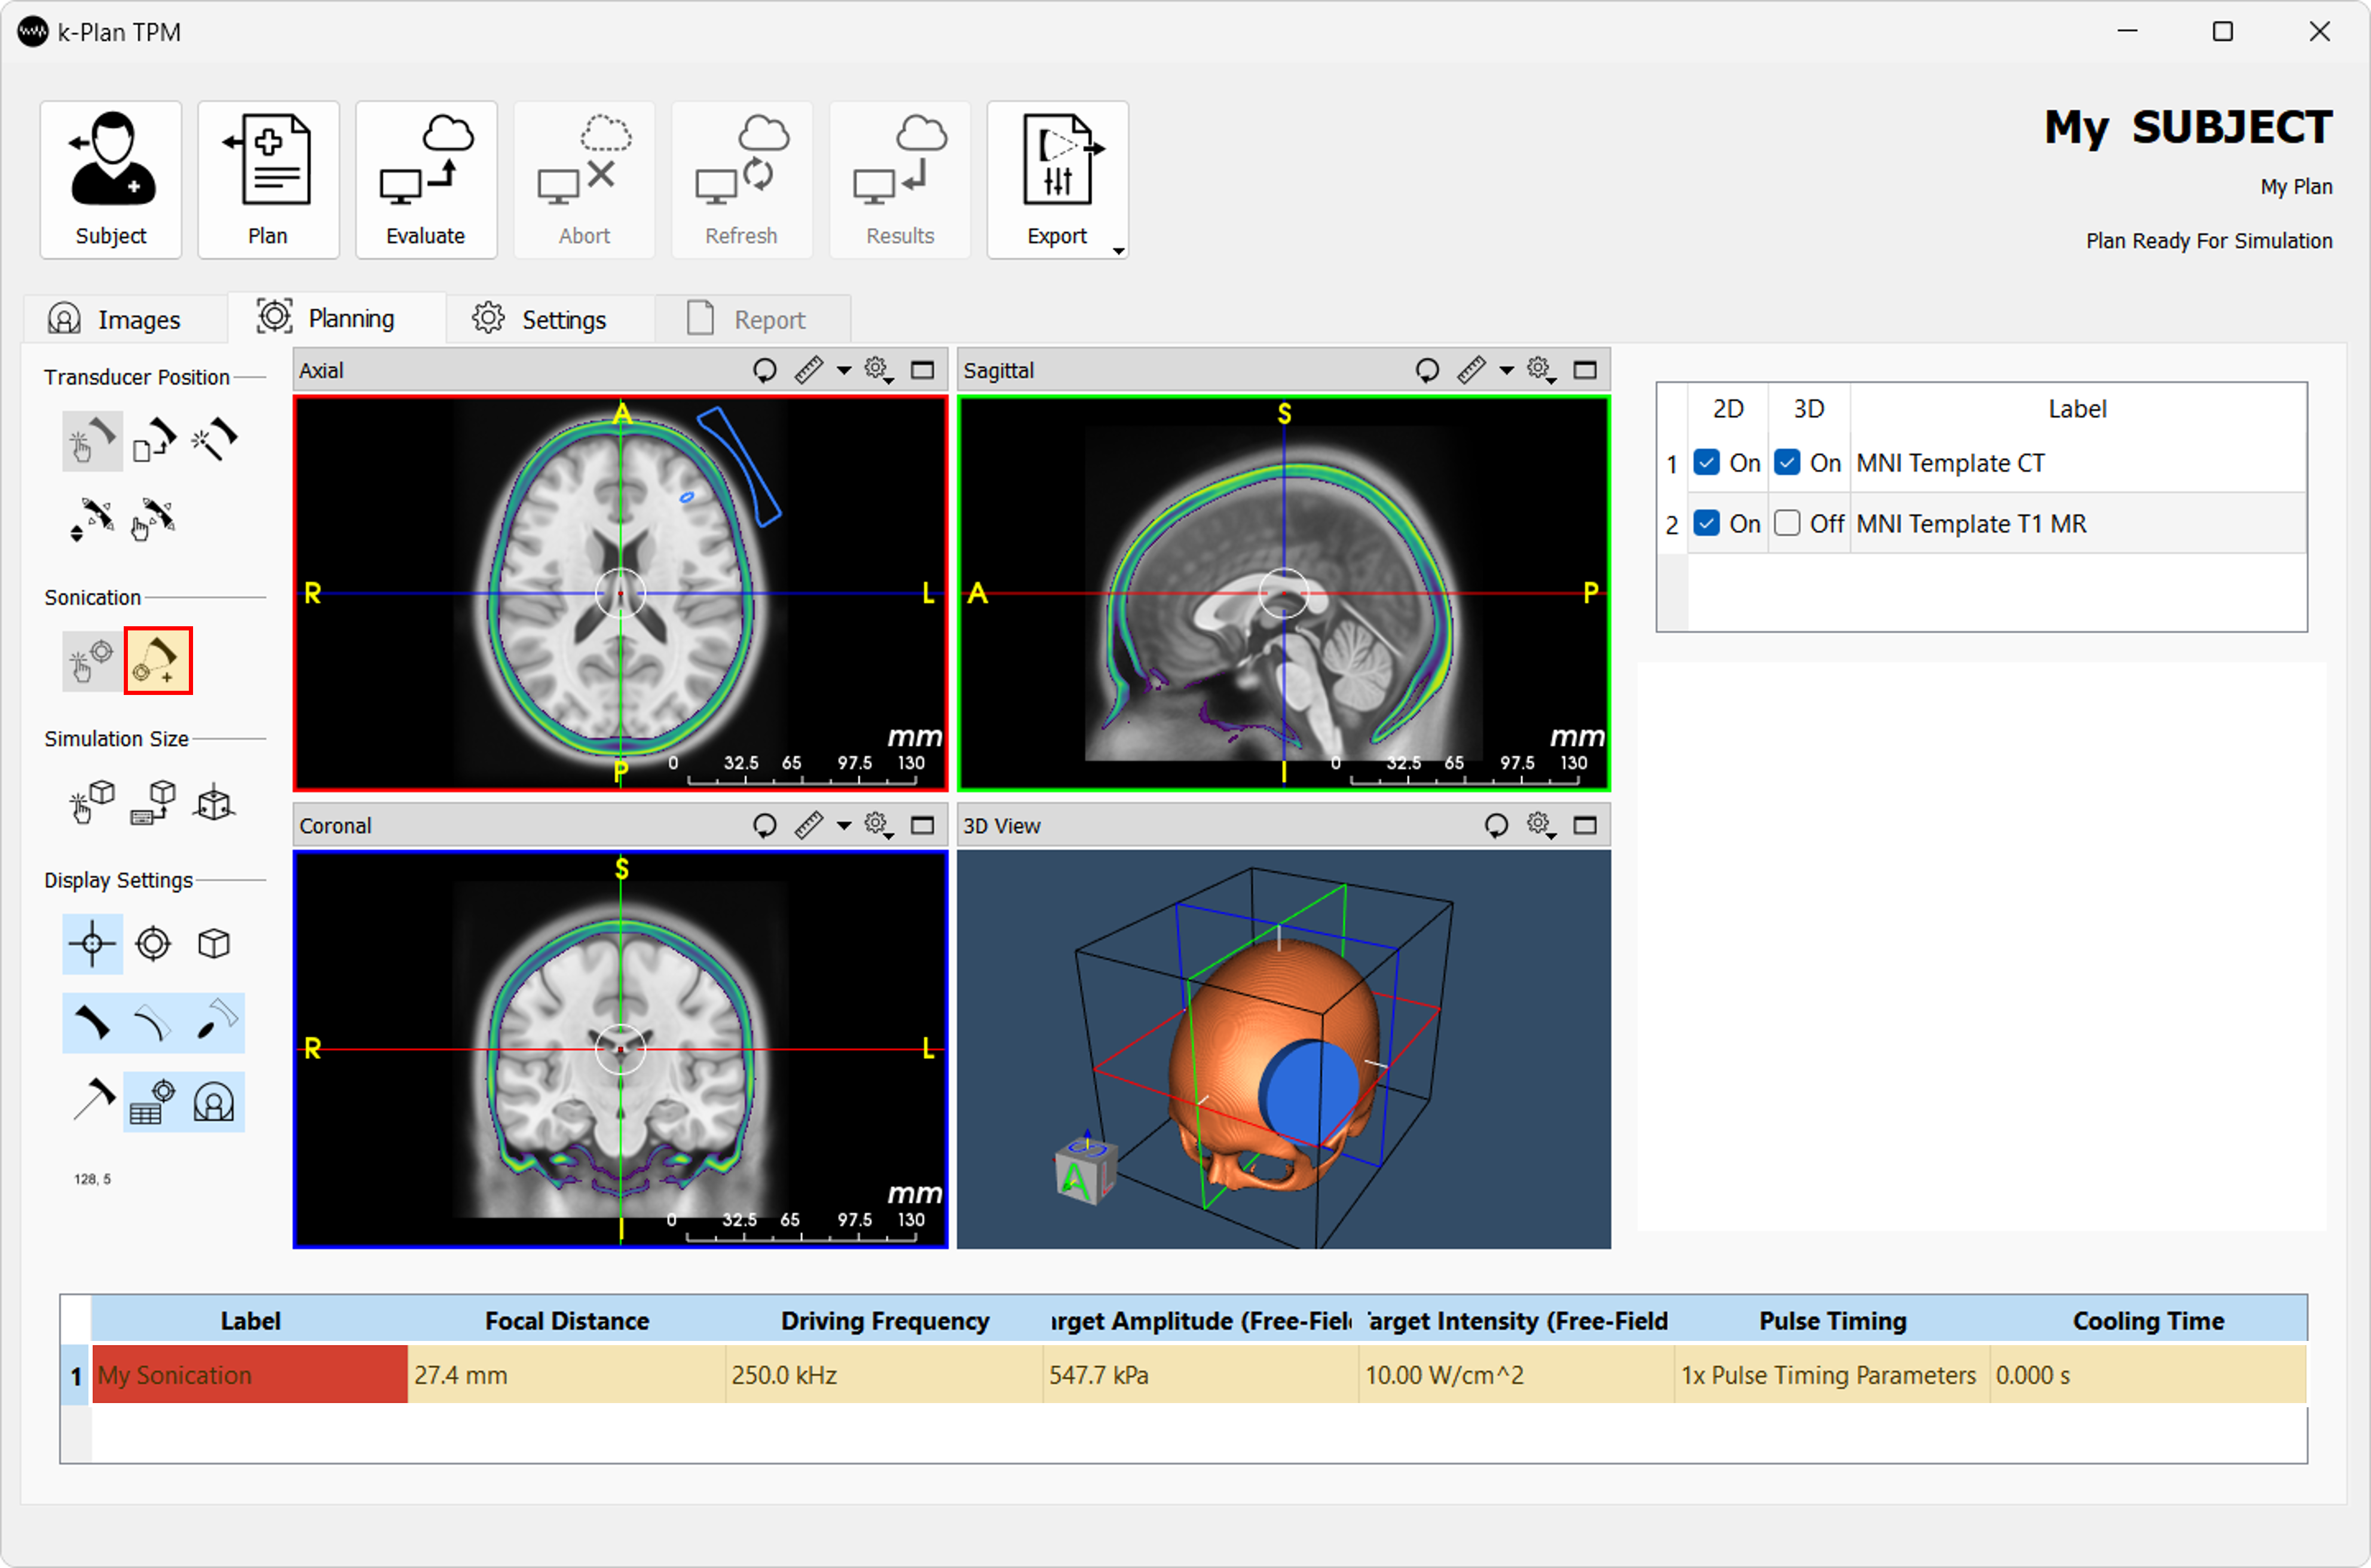
-
To adjust the pulsing pattern, right click on the sonication in the sonication table and select
Edit pulse timing parameters.... Adjust the parameters and then selectSave.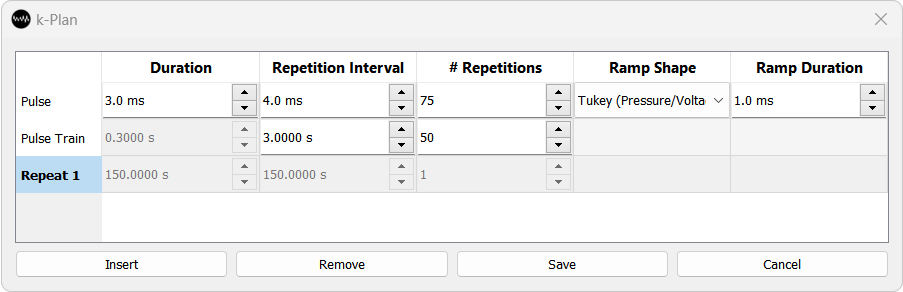
-
Move the transducer position and add more sonications as required. To reload the transducer position for a given sonication, right click on the sonication in the sonication table and select
Reload transducer position.Adjusting the transducer position
After a sonication has been added, the transducer position for that sonication cannot be adjusted. To modify the transducer position the sonication must be removed and re-added.
-
The simulation domain defines where the pressure and temperature fields will be calculated. The simulation domain is automatically displayed after adding the first sonication. Adjust the simulation domain by selecting
Resize Simulation Domain Using Cursor . Select
 Shrink Domain Size To Minimum Allowable to give a small domain size (fastest compute time). Manually adjust the simulation domain (white box) by using the cursor to drag the small white spheres to ensure the box covers the region of interest.
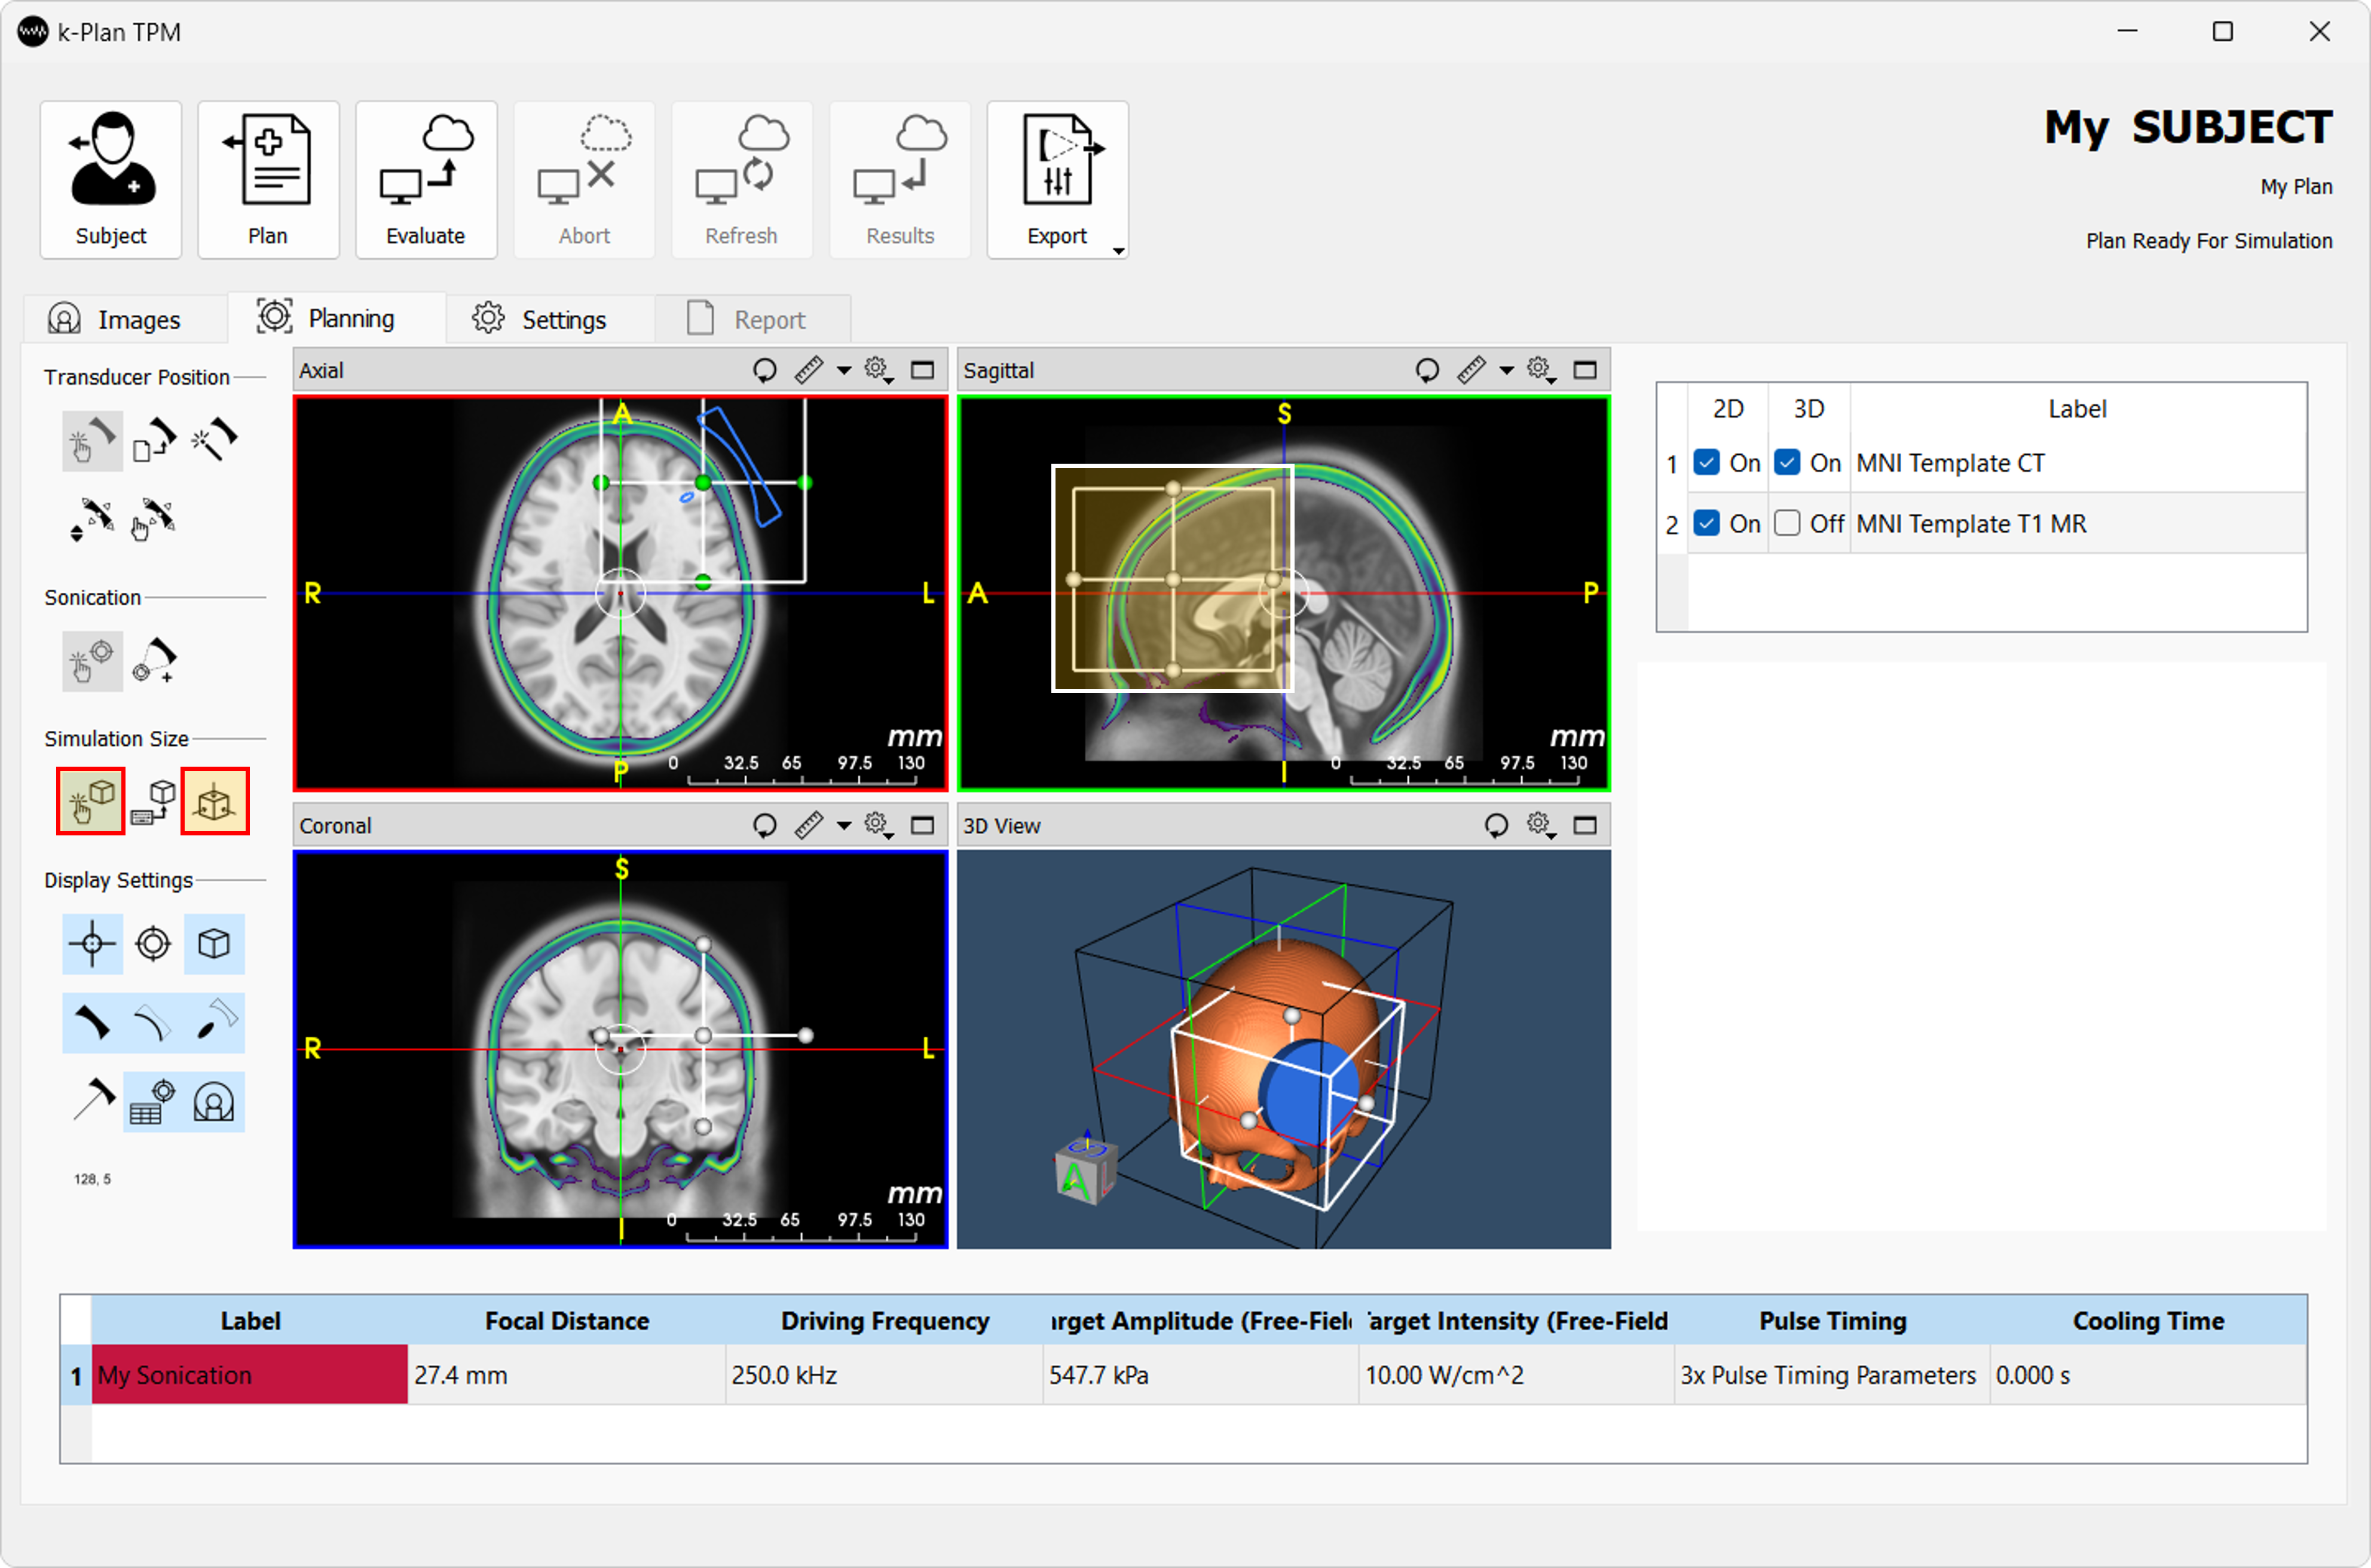
-
For exploratory simulations, switch to the
Settingstab and reduceGrid points per wavelengthto 4. This reduces accuracy, but also decreases simulation time and cost. -
Once the plan is complete, click the
Evaluatebutton on the top toolbar to submit the plan. This will generate the planning file and upload it to the cloud for evaluation. -
The status of the selected treatment plan is shown in the top right corner (along with the subject and plan names). The status of all running plans is automatically refreshed every three minutes. To manually refresh the status of the selected plan, click the
Refreshbutton in the toolbar. To manually refresh the status of all plans, clickRefresh Statusin the plan browser dialog. -
The plan evaluation happens asynchronously. This means it is possible to close k-Plan while a plan is being evaluated, or submit multiple plans for evaluation at the same time. While waiting for the plan evaluation, try creating a new plan with different settings.
-
When the status of a plan changes to
Simulation Complete, Ready For Download, click theResultsbutton in the top toolbar. This will download the results file and add the results images to the images tab.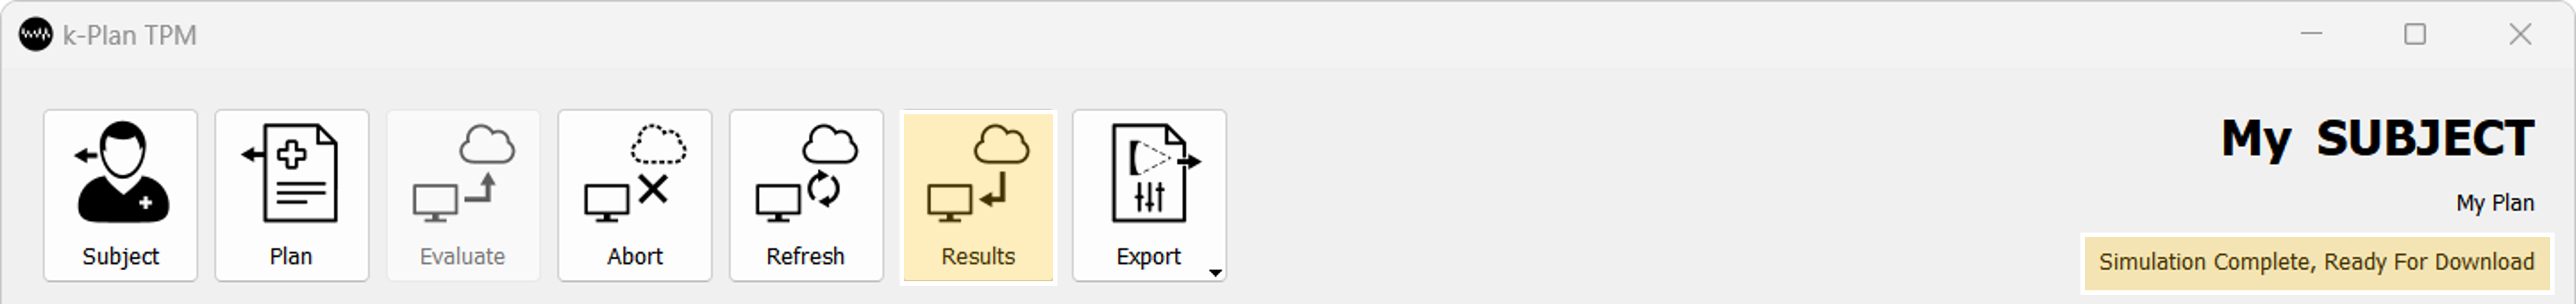
-
To view the results, switch to the
Planningtab, and select the 2D checkbox next to the results name. First, verify the segmentation is correct. Then, adjust the results view as desired. For example:- Right click on the image name and select
Focus On Maximumto automatically slice through the maximum value. - Reload the transducer position for a given sonication by right clicking on the sonication in the sonication table and selecting
Reload transducer position. Switch on and off display of the transducer device and the individual transducer elements
  .
. - View the simulated values by selecting
View Voxel Values in the
 Display Settingsbuttons. This displays the values under the reslice cursor for the visible images. Other display settings can be toggled on and off in the same toolbar.
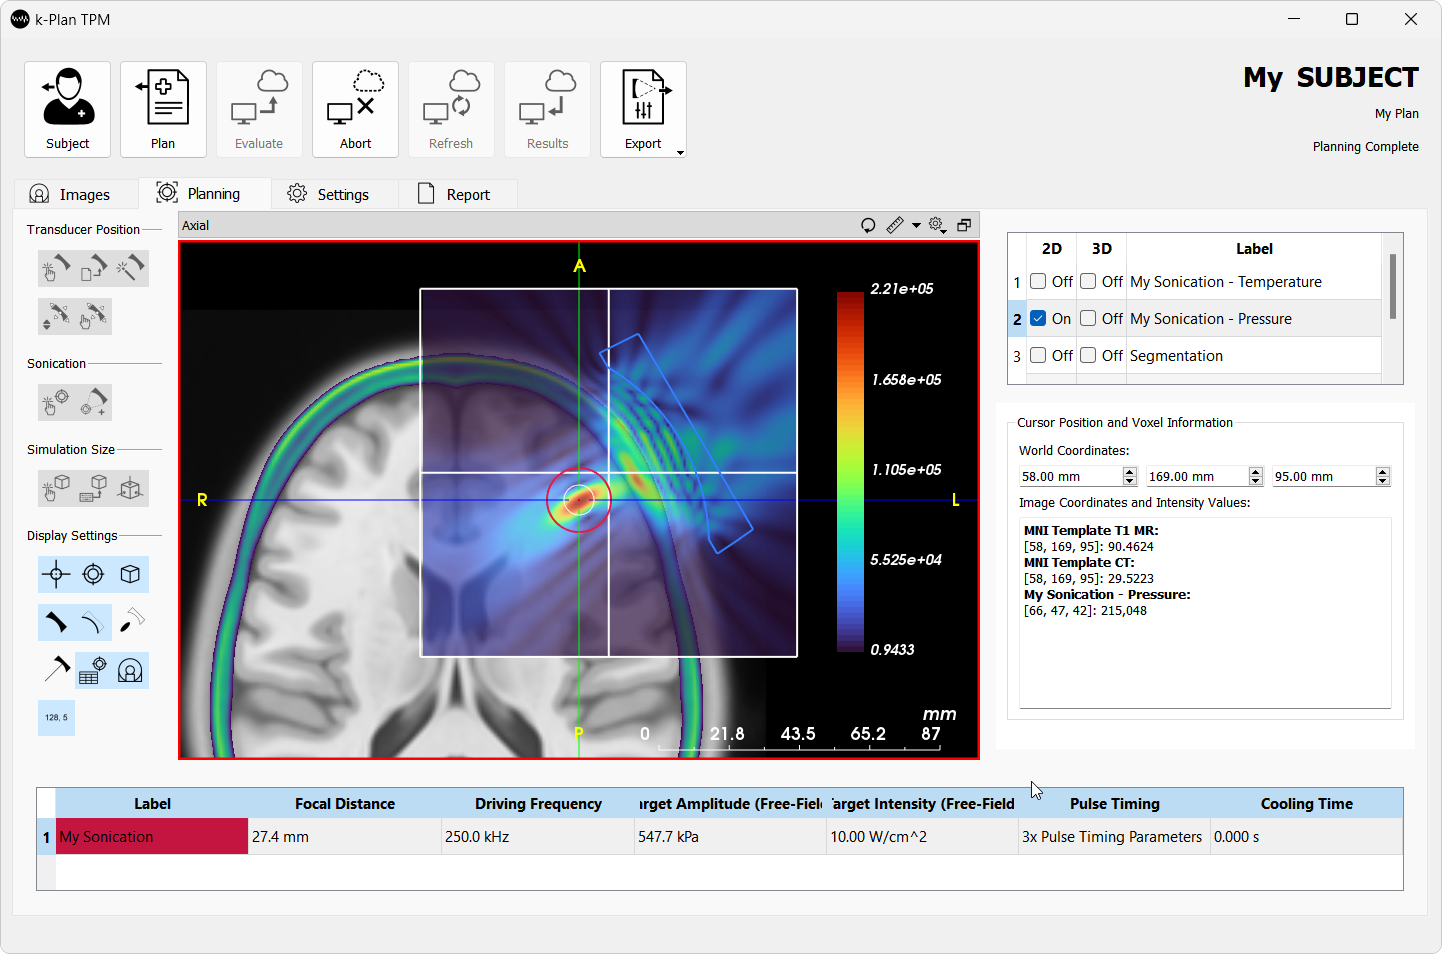
- Right click on the image name and select
-
Switch to the
Reporttab to see a report of the plan. The report can be exported by selectingExport Report To PDFfrom theExportbutton in the top toolbar. The same button also allows export of the transducer positions and control parameters for external hardware devices.