Report
Viewing the report
Once a plan is complete, a planning report can be selecting the ![]()
Report. The report summarises the plan and sonication information, as well as the pressure and temperature exposure parameters for each sonication. These parameters follow the ITRUSST consensus on standardised reporting for transcranial ultrasound stimulation. The report is broken into several sections as outlined below. The report can be exported by selecting Export Report To PDF from the Export button in the top toolbar.
Plan summary
The plan summary provides an overall summary of the planning results. The subjection information is populated from the information entered in the subject browser dialog. The plan information is populated from the plan label, comments, and transducer selection entered in the plan browser dialog.
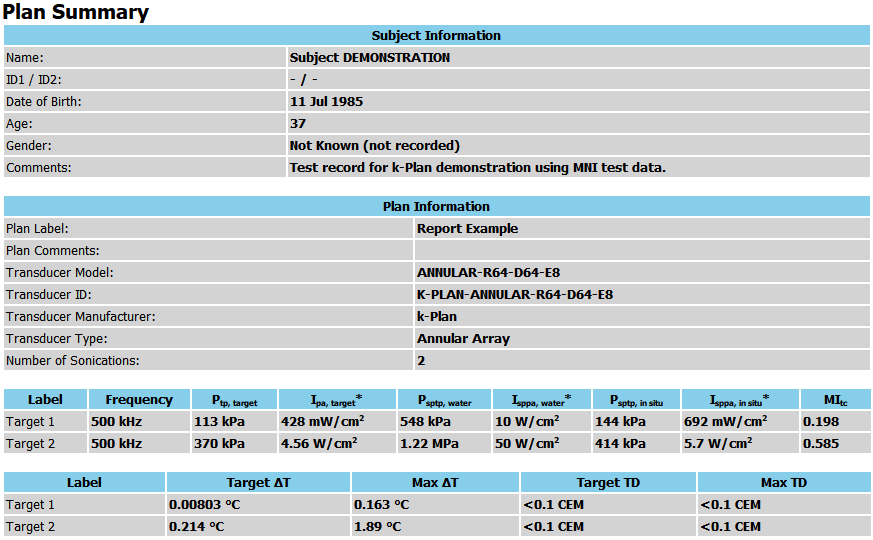
Two summary tables are then provided. The displayed parameters depend on the transducer type and simulation settings. For simulations executed using older versions of k-Plan, not all parameters may be displayed.
The first table provides a summary of the acoustic output and exposure parameters for each sonication:
- Label: The sonication label entered in the sonication table.
- Frequency: Driving frequency used for each sonication.
- Ptp, target: Temporal peak pressure (pressure amplitude) at the target position for each sonication. For multi-element arrays, the target position is the target selected when using the
Add Sonication Target Using Alt-Clickor entered in the sonication table. For single-element transducers and annular arrays, the target position corresponds to the centre of the focal ellipsoid (the estimated target position in water). - Ipa, target: Pulse average intensity at the target position for each sonication. All pulse average intensities are derived from the acoustic pressure and do not account for any ramping.
- Psptp, water: Theoretical spatial peak, temporal peak pressure in water (free-field pressure amplitude).
- Isppa, water: Theoretical spatial peak, pulse average intensity in water.
- Psptp, in situ: Calculated spatial peak, temporal peak pressure after running the simulation (in situ pressure amplitude).
- Isppa, in situ: Calculated spatial peak, pulse average intensity after running the simulation.
- MItc: Transcranial mechanical index calculated from the in situ pressure amplitude. For versions of k-Plan where the regional peak values are reported, MItc is computed from the Psptp value in the head (excluding the skull). For earlier version of k-Plan, MItc is computed from Psptp, in situ.
If a thermal simulation is performed, the second table provides a summary of the thermal output parameters for each sonication:
- Label: The sonication label entered in the sonication table.
- Target \(\Delta\)T: Peak temperature rise at the target location.
- Max \(\Delta\)T: Peak temperature rise anywhere in the simulation domain.
- Target TD: Thermal dose at the target location, measured in cumulative equivalent minutes at 43 degrees Celsius (CEM43). As the thermal dose values can be very small, If the thermal dose value is below 0.1 CEM, the value is shown as <0.1 CEM.
- Max TD: Maximum thermal dose anywhere in the simulation domain.
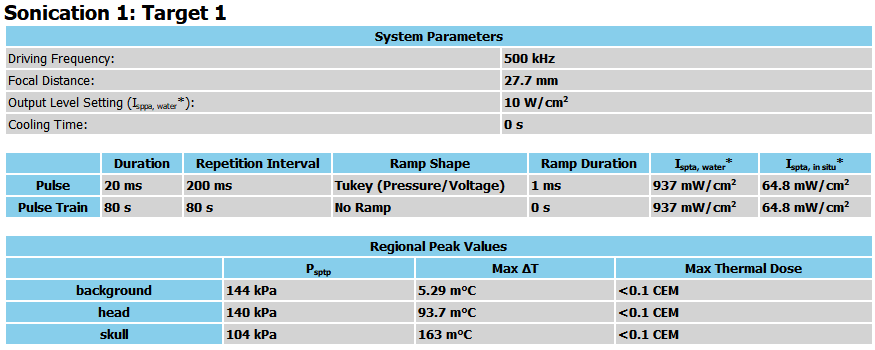
Sonication details
The next section/s of the report provide additional details for each sonication in the plan. This includes the output level settings and the pulse timing parameters for each sonication. The output level setting corresponds to the Target Amplitude specified in the sonication table. The regional peak values table provides the spatial peak, temporal peak pressure (in situ pressure amplitude), peak temperature rise, and maximum thermal dose for each region given in the [results.md#verifying-the-segmentation].
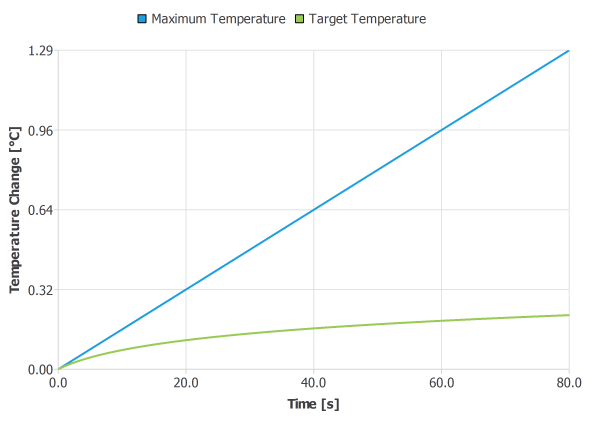
A plot of the temperature change over time is also displayed. Note, the maximum temperature curve can be very coarsely sampled, as the value is only extracted after each pulse (or pulse train if the pulses are short). The target temperature, if displayed, is sampled at every time step.
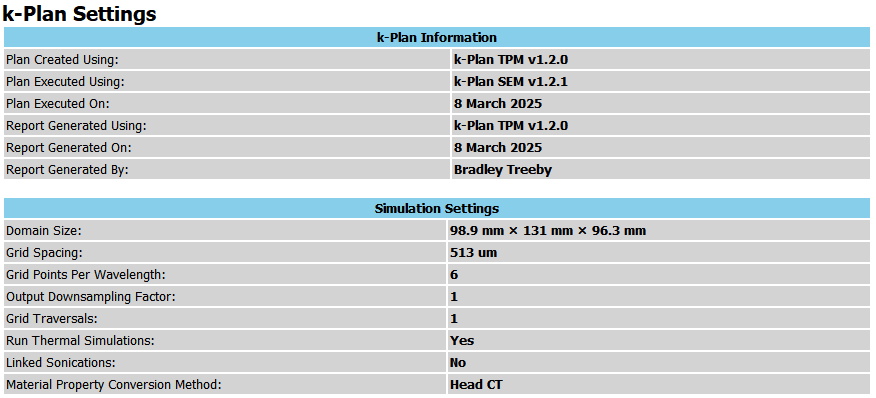
k-Plan settings
The section summarises the version of k-Plan planning module (TPM) and simulation execution module (SEM) used to create and execute the plan settings selected in the plan developer dialog.
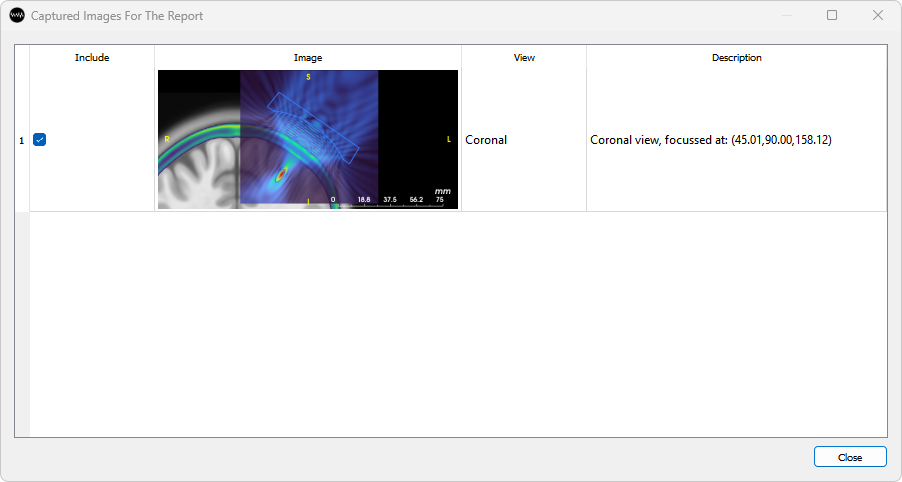
Plan images
The final section of the report displays report images captured using the ![]()
Capture Image For Report button above each image view in the Planning tab. A list of report images can be viewed by clicking the dropdown button next to the camera icon and selecting Report Image Browser. This open a dialog window that displays the captured images. The image description can be modified by clicking on the description, images can be included or excluded from the report by toggling the Include checkbox, and images can be permanently deleted by right clicking on the image and selecting Delete image.